Graphical Analysis
Overview
|
With Graph Details, find all Graphs related to a Service Group, Logical Group or Configuration Item and see the Attributes plotted at any point in time still retained by the Data Retention Settings. See a list of all Attribute values plotted for the selected date/time, and when those individual Attribute values were collected. Then export the Graph as an image (SVG or PNG) or as a CSV of Attribute values and their collected time stamps. For any Graph or Attribute, jump directly into the Graph Analysis page to alter the Attribute selections, order, display, annotations, and date range to get a visual analysis of those Attributes without changing existing Graphs. It combines the functionality of the Graph Edit Form with Graph Details to create ad-hoc visualizations to export as images or a CSV. |
Graph Details
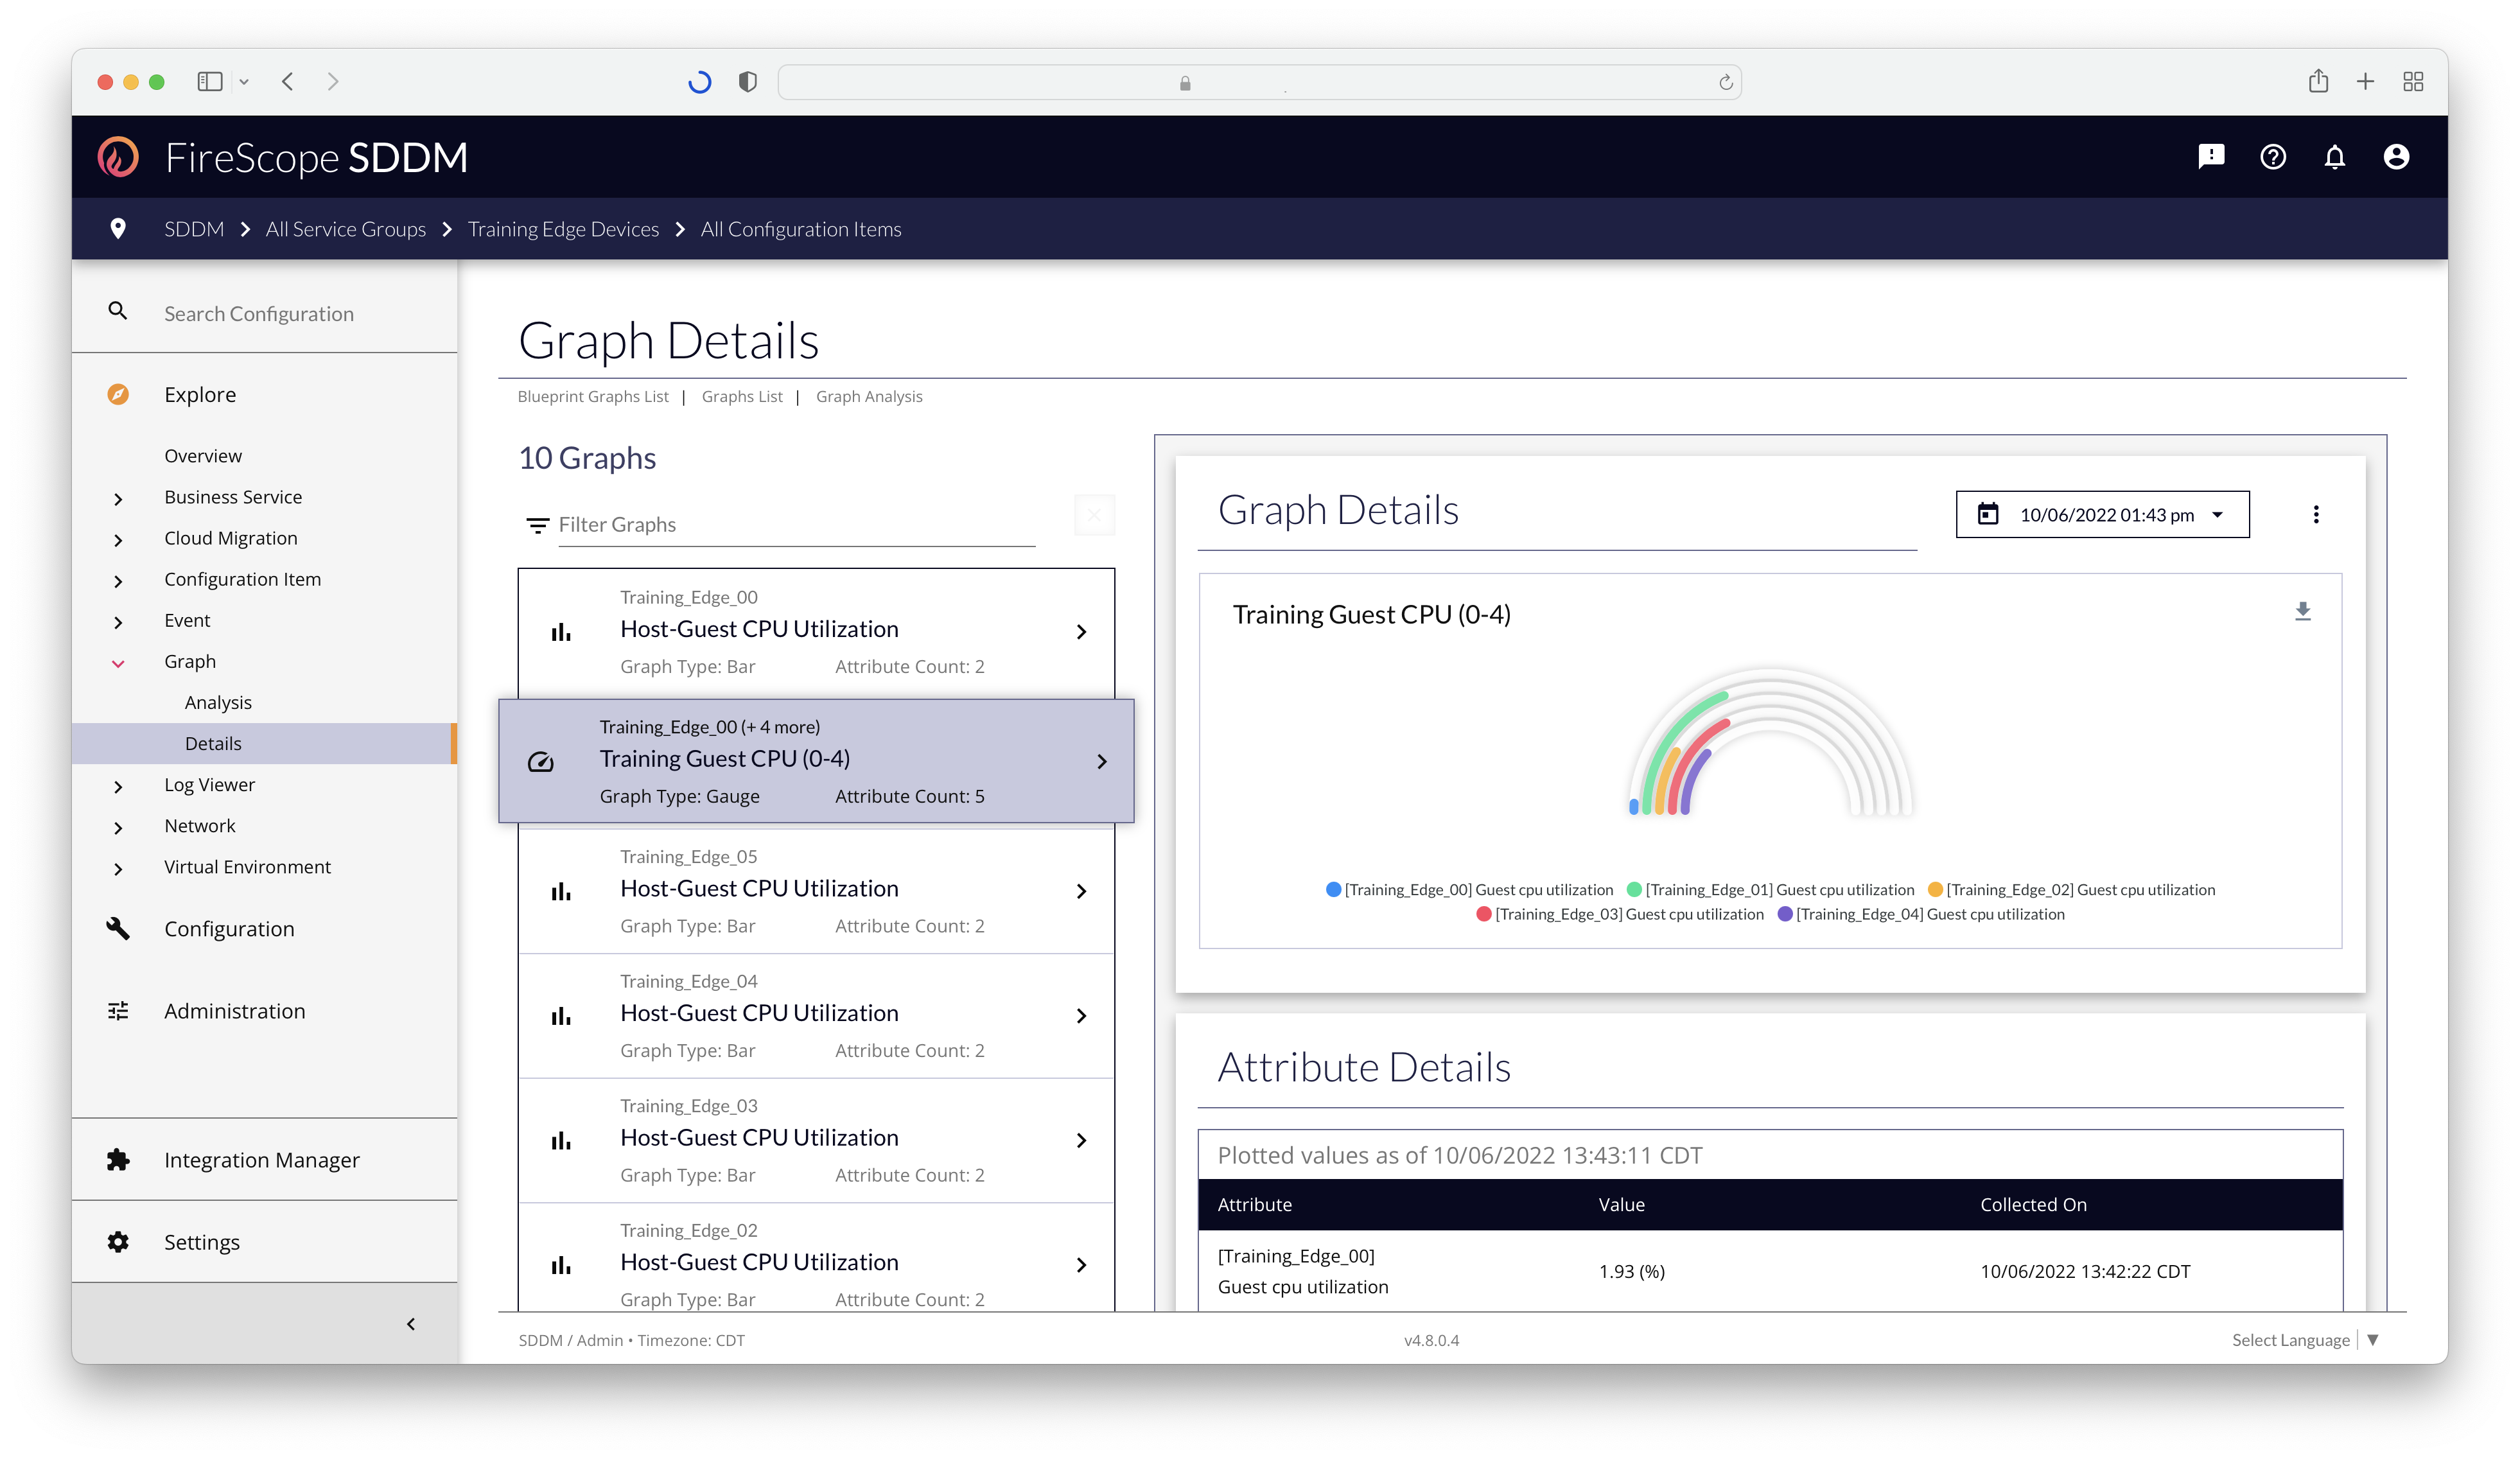
The Graph Details page offers the ability to view any Graphs related to any CIs or groups of CIs whose Attributes are used to plot them.
The Graphs offered are limited to the Service Group & Logical Group assignments in the User Groups for the User.
Historical Graphs
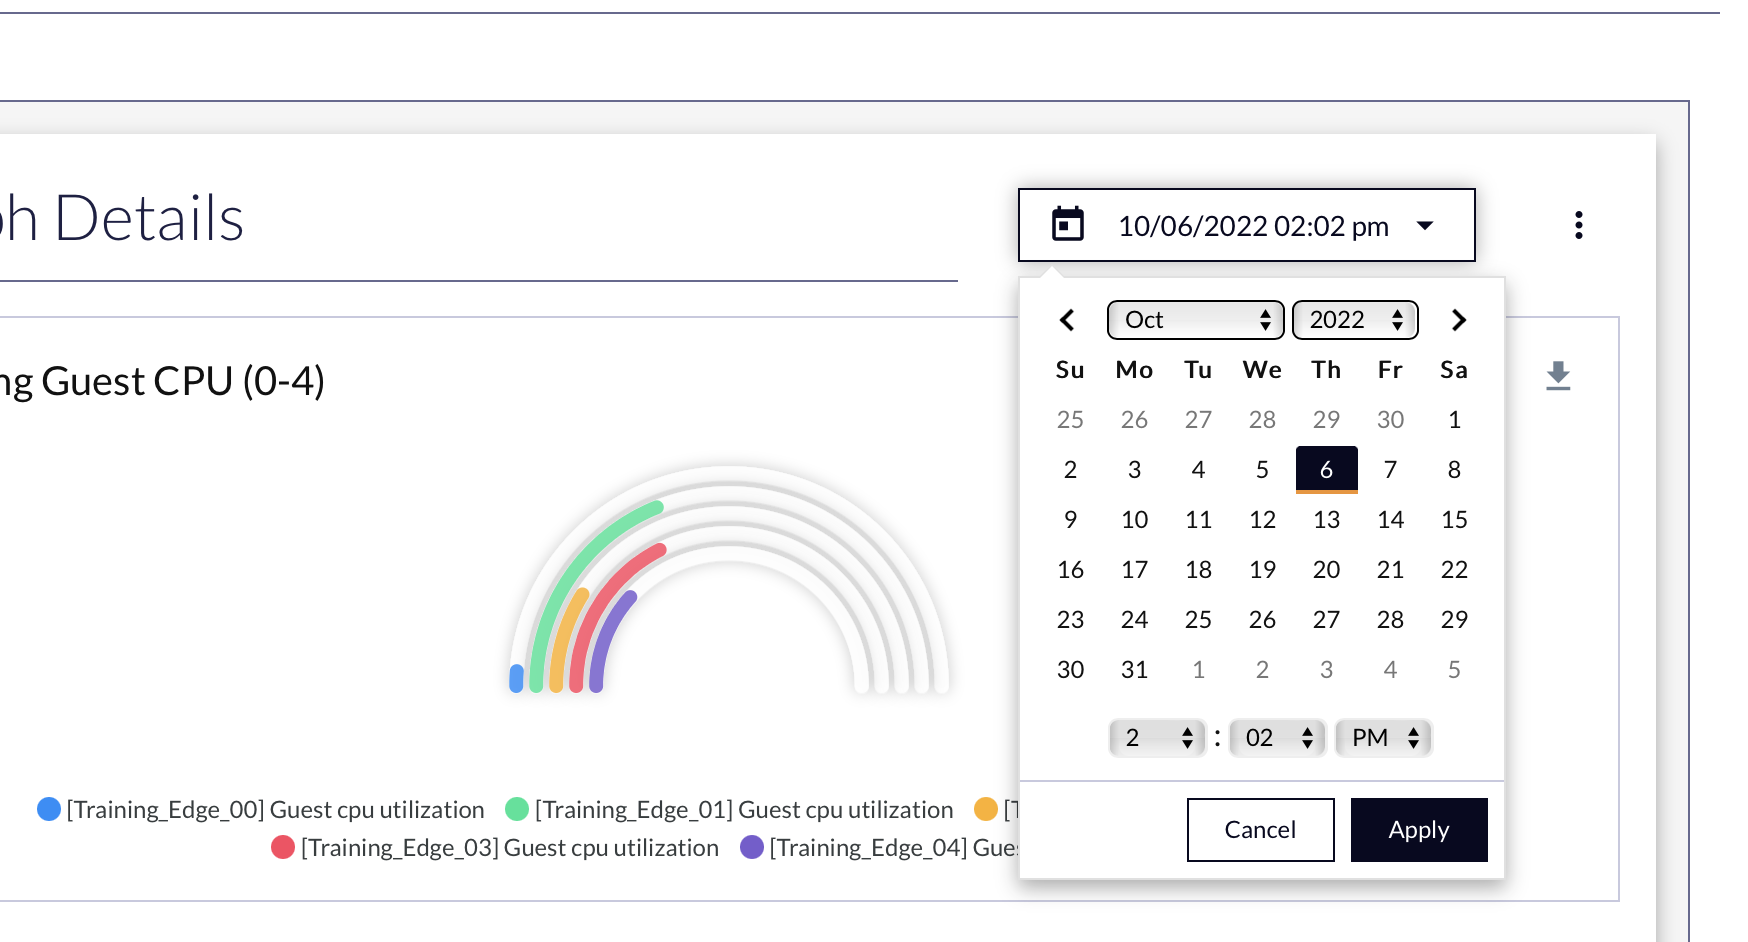 |
For Graph Types: Bar, Bar (stacked), Donut, Gauge, and Pie The Date Time Picker is used to select a single point in time for Attribute values. Based on the Data Retention Settings for "Numeric (Float) Data" and "Numeric (Integer) Data", the Attribute values that can be plotted for a given date/time may be limited, or no longer available. |
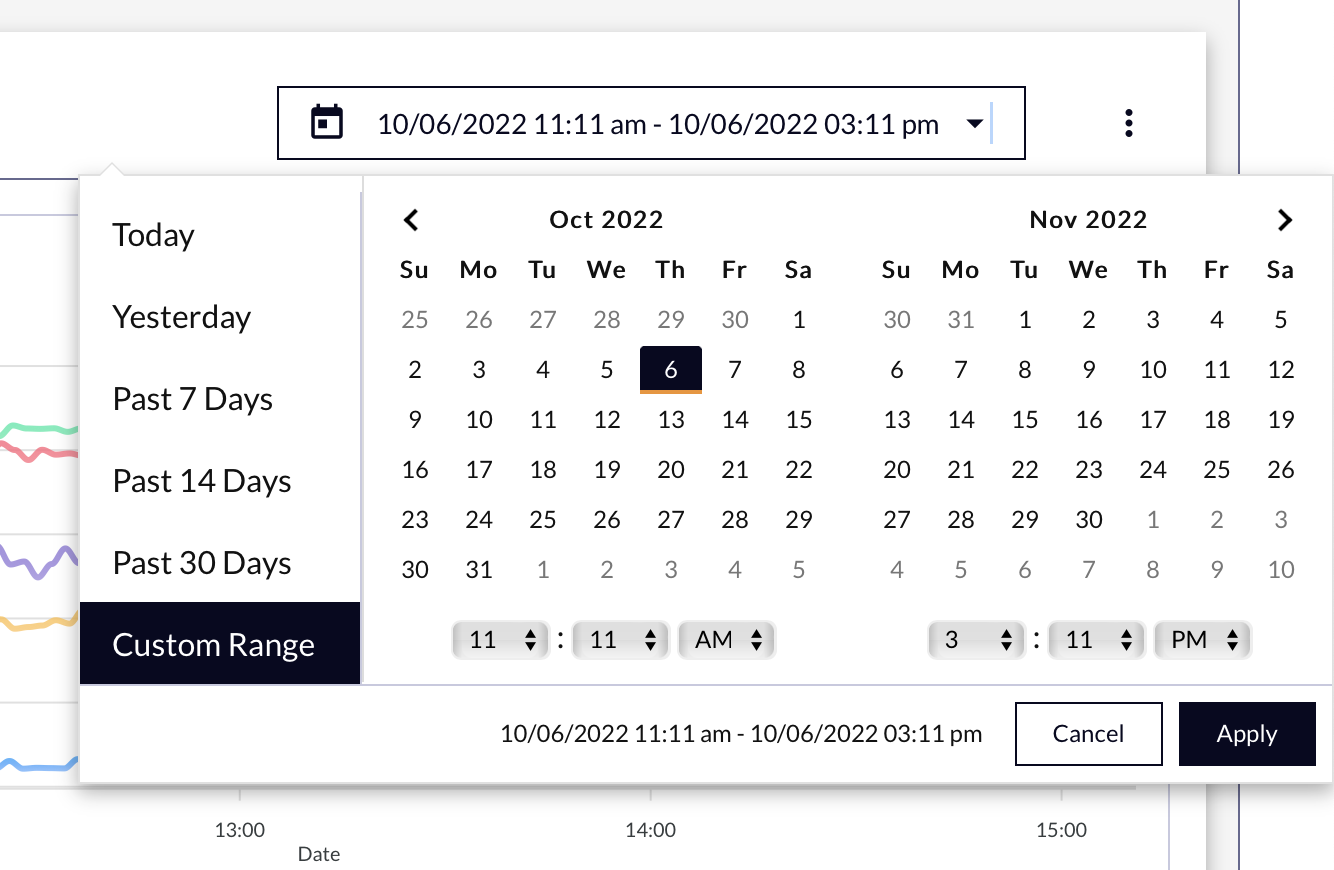 |
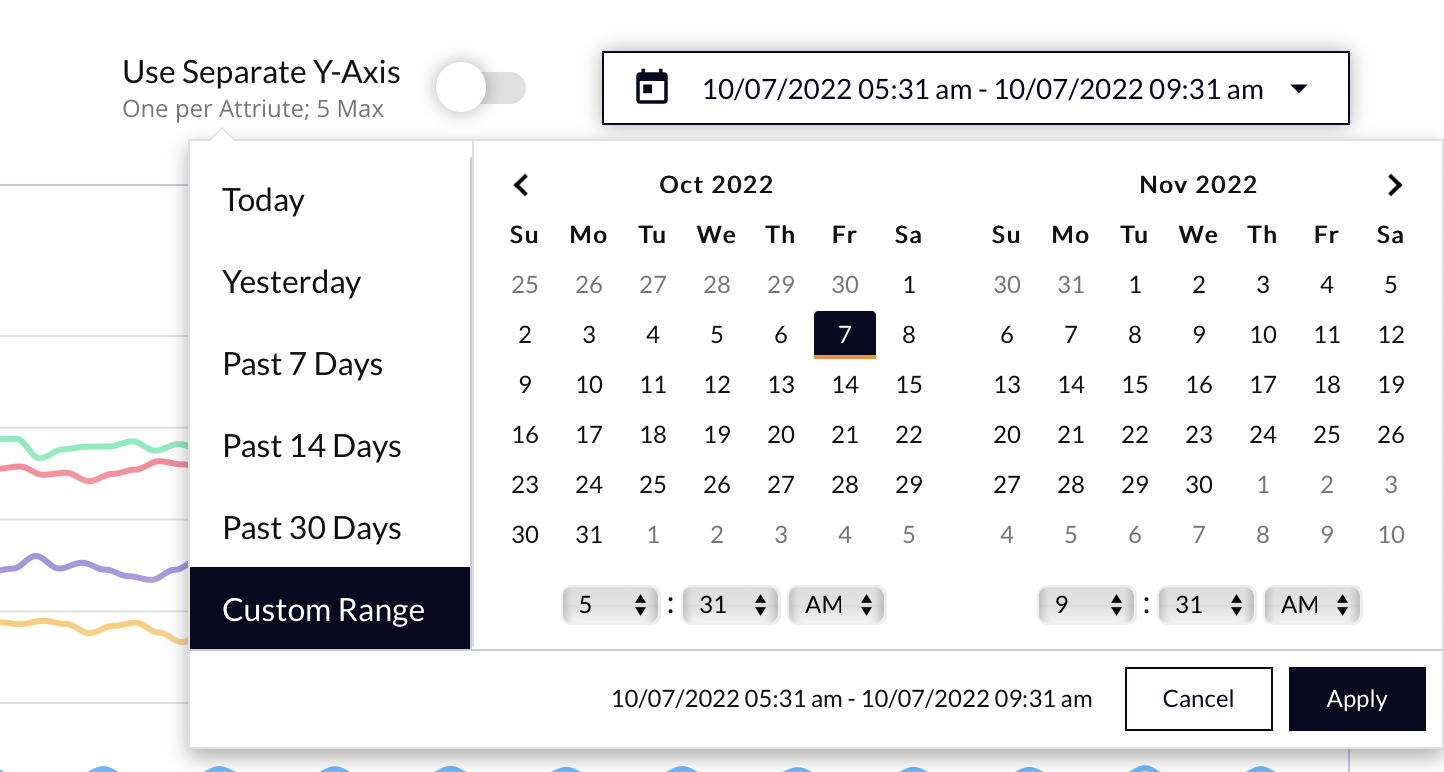
For Graph Type: Line The Date Time Range Picker is used to select a time window for Attributes values. Based on the Data Retention Settings for "Numeric (Float) Data" and "Numeric (Integer) Data", the Attribute values that can be plotted for a given date/time may be limited, or no longer available. |
Graphed Attribute Values
|
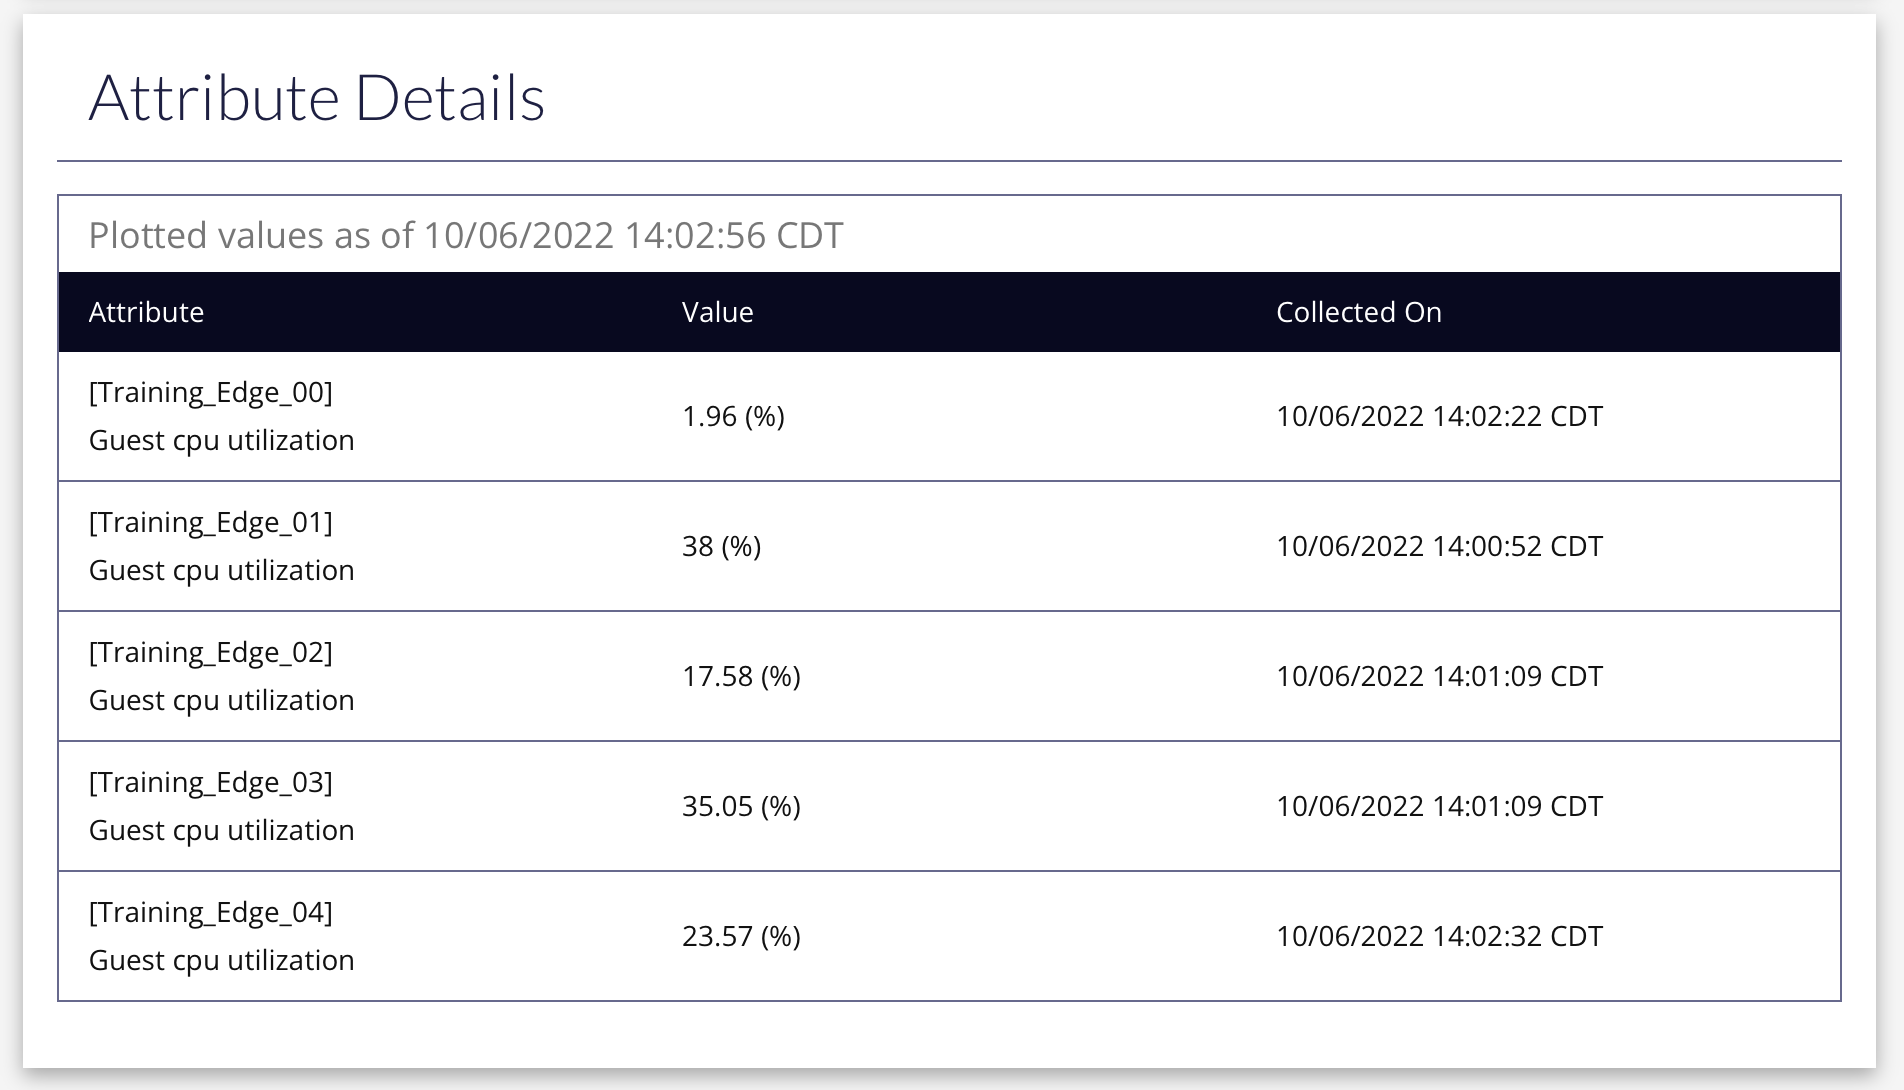
For Graph Types: Bar, Bar (stacked), Donut, Gauge, and Pie Plotted Attribute values will be collected into a single table. At the top of the table will get the requested date/time to plot. Within the table will be the list of Attributes Names, their CI Names, their value at the requested time, and when that value was collected. Some Attributes collect at different intervals, or may have gaps. This table shows the last known value at the requested time, and when that value was collected. |
 |
|
For Graph Type: Line Plotted Attribute values will be collected into a table for each Attribute. At the top of the table will be the Attribute's name, and the requested date/time range to plot. Within the table will be the list of times the Attribute returned a value, and what value was returned. Some Attributes collect at different intervals, or may have gaps. This table shows the available data points to plot based on Data Retention Settings, and will indicate where there are gaps or missed value collections. |
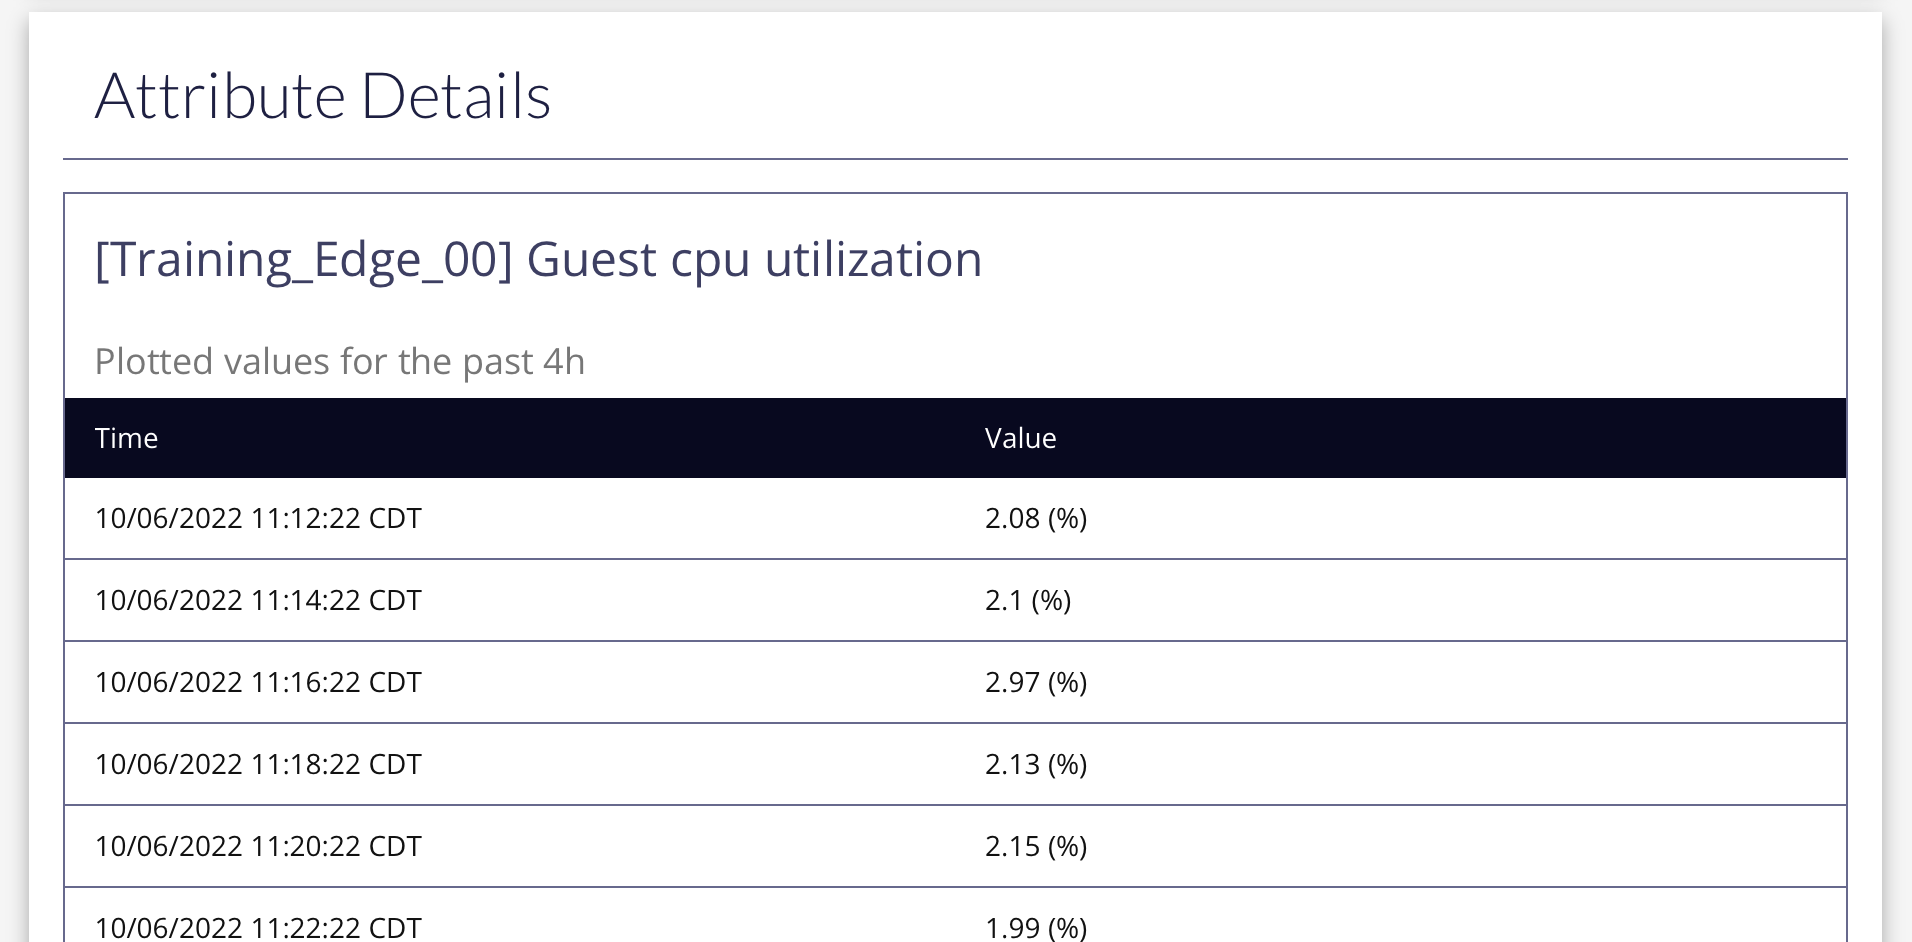 |
Graph Toolbar and Export
On most Graphs, there is a series of 1-4 icons:
- Magnifying Glass - The default selection of time-series graphs, which allows the user to zoom into an area of the Graph by selecting it with a click-and-drag of the mouse. (Only for Line Graph Types)
- Hand - Allows panning a zoomed Graph. Click the hand icon, then click and drag on the chart area to move the visible data side to side. (Only for Line Graph Types)
- Restore - Restores a zoomed/panned chart area back to the initial view. (Only for Line Graph Types)
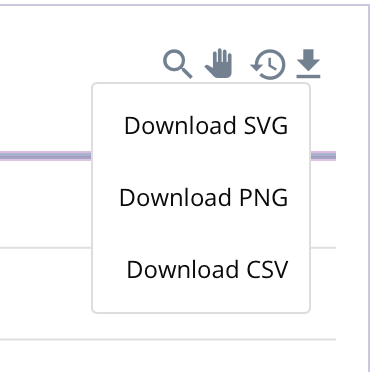
- Download - If the user's Account allows for Data Egress, options to download the chart as an image or CSV file will be offered.
Exporting a GraphAn Image of the Graph, as-displayed, can be downloaded by clicking either Download SVG and Download PNG. A CSV Data Export of the plotted Attribute Values and their times can be downloaded by clicking Download CSV. If the Line Graph uses Attributes which do not share the same collection intervals and times, the Download CSV option will not be offered as there cannot be a correlation between some Attribute Values and others to put into a CSV table. |
 |
Graph Analysis
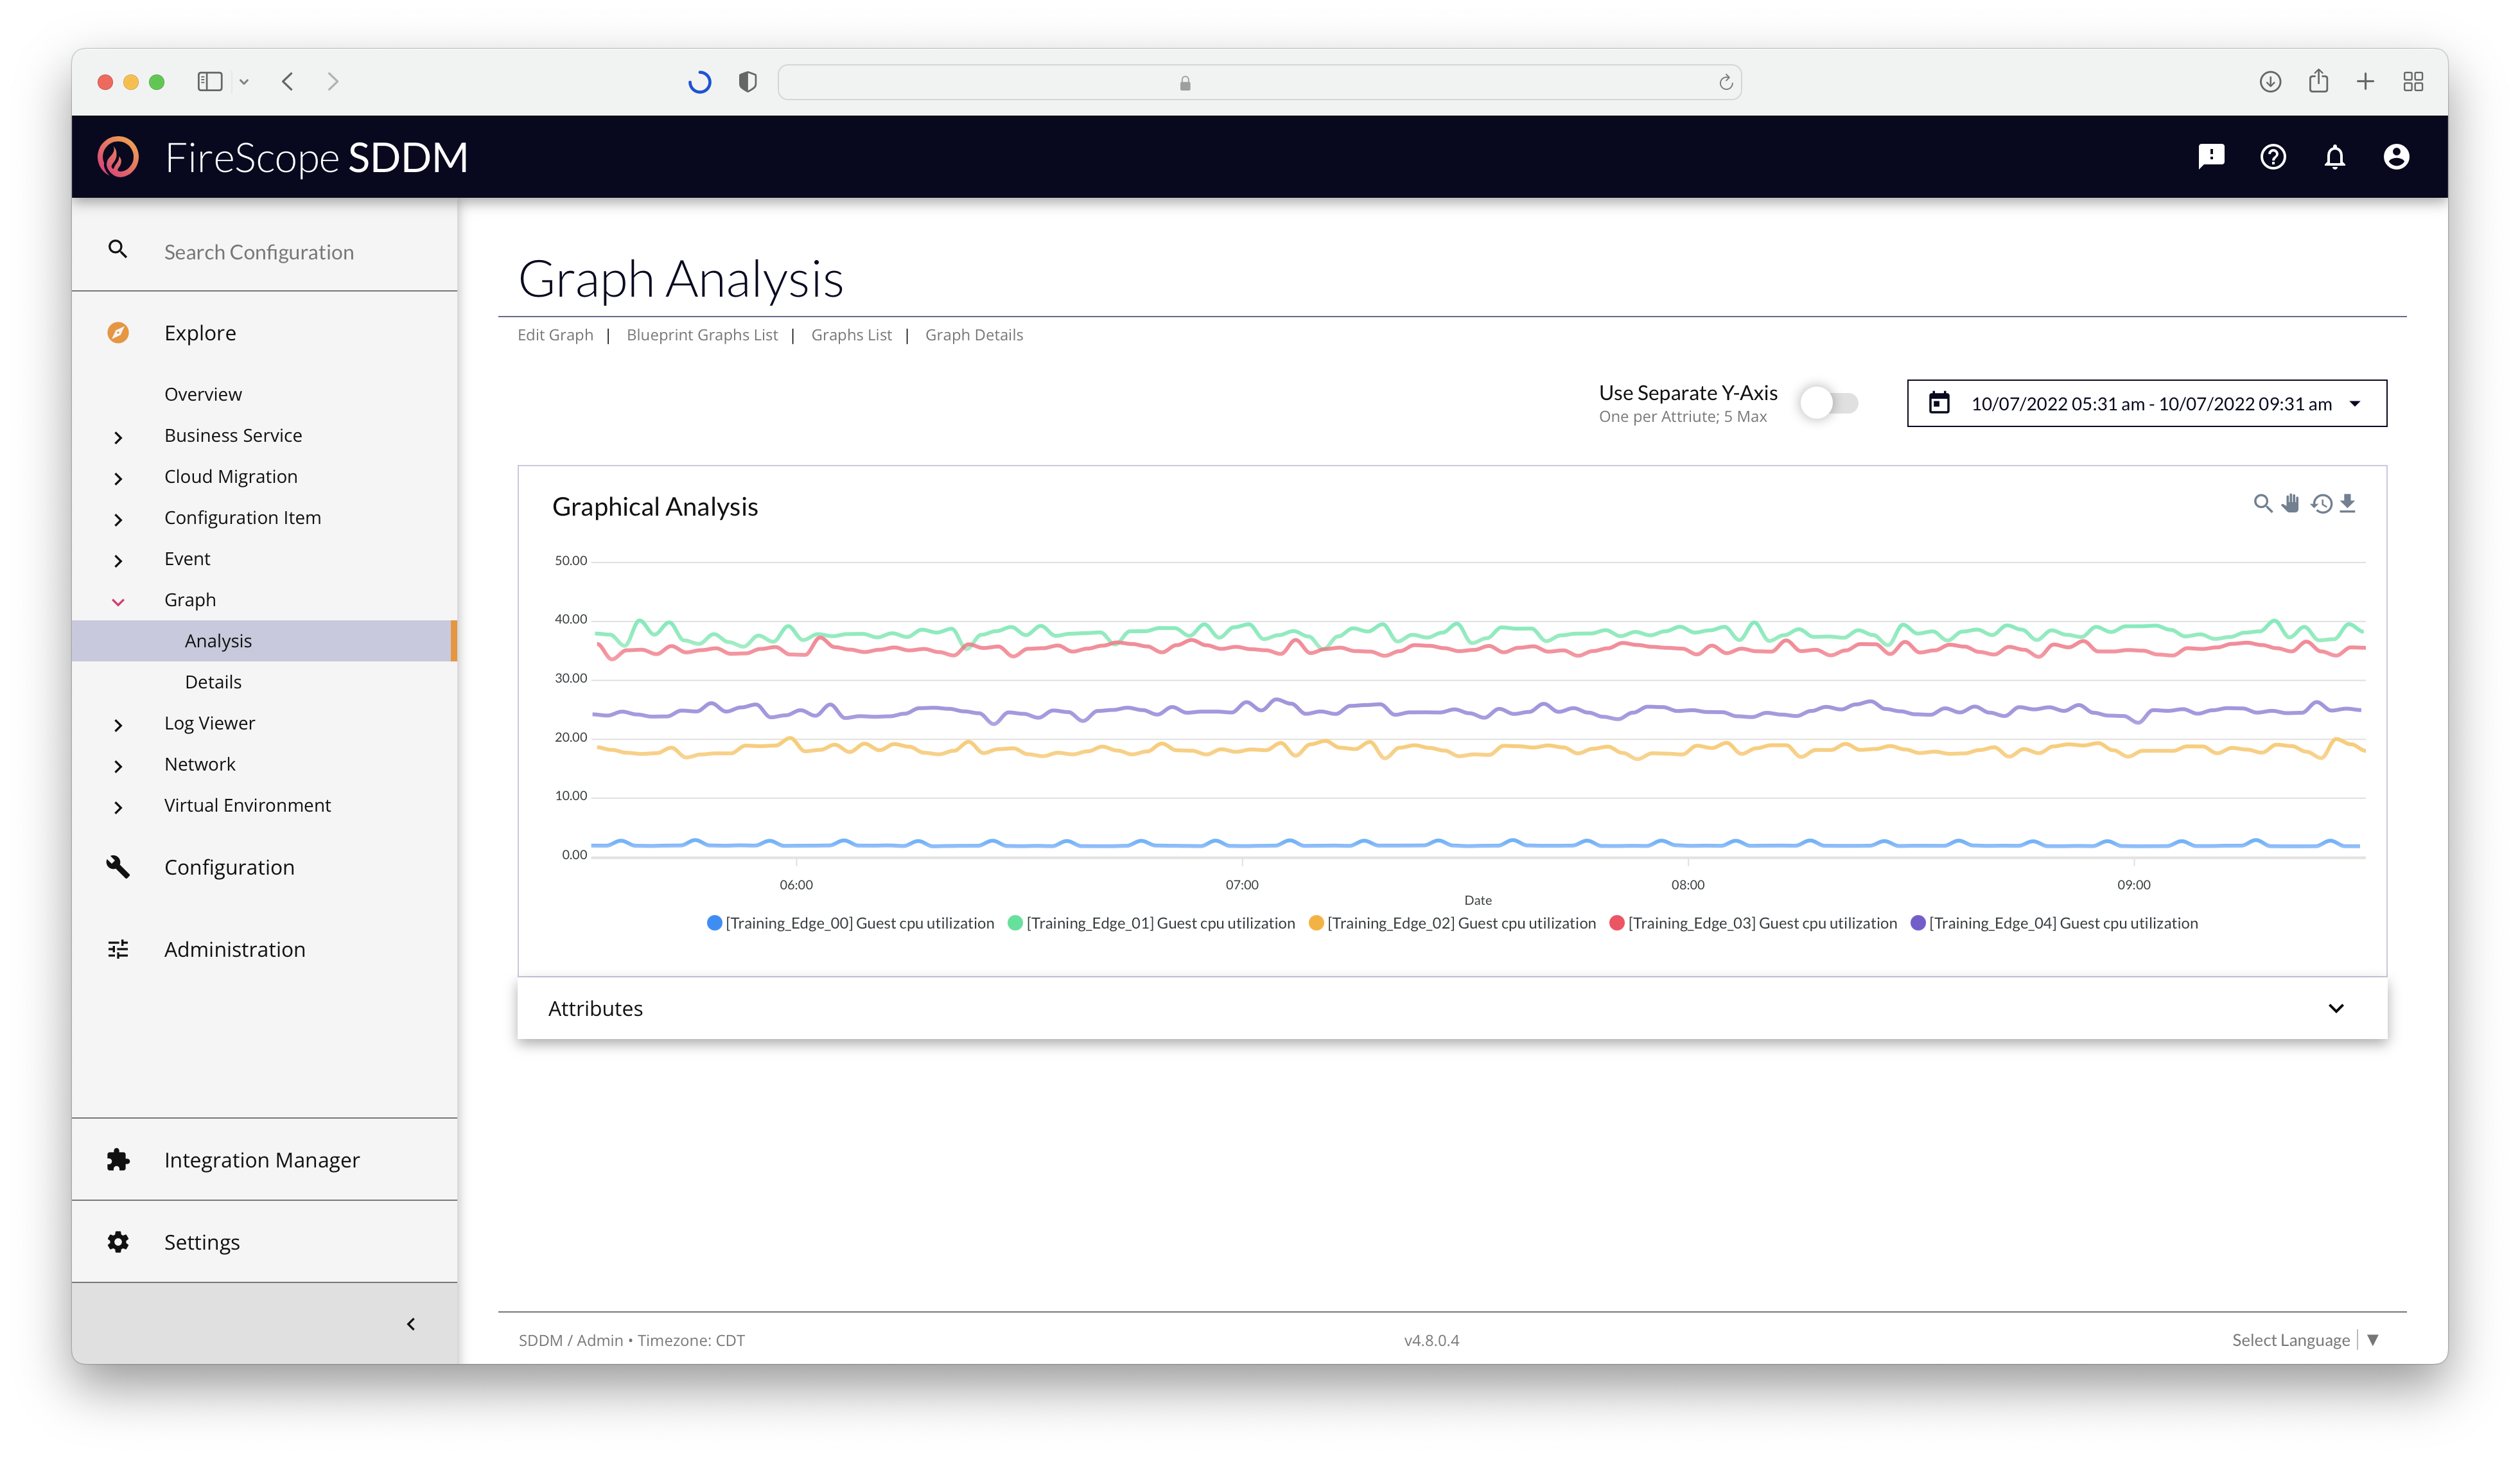
Available to FireScope Service Analyst users and above, the Graphical Analysis page offers the ability to plot an XY time series line chart, either from scratch with manually selected Attributes, or from an existing Graph's Attributes. The resulting chart can then be altered without impacting any existing Graph that may have provided its data to get started. This page combines the functionality of the Graph Details chart with the Attributes Panel of the Edit Form for users that are not allowed to create actual Graph objects in the application.
Graph Analysis Controls
|
 |
Attribute Panel
This panel works exactly like the Edit Form's Attributes Panel for Line Graph Types.
FireScope Service Analyst users will only be able to chart Attributes of CIs that have been made available to them through Service Group or Logical Group assignments to their User Groups.