Attributes
Overview
In order to ensure you are receiving the richest set of system events and data possible, FireScope offers a variety of data collection types to choose from. You can select data collection methods on a host-by-host basis. For instance, data on network equipment can be collected through SNMP, while servers communicate through rich agents. Not all data collection methods offer the same range of data types, and each has its own set of limitations and prerequisites. The table below will guide you through the available collection methods to help you strategize the best deployment for your unique environment.
| Method | Requirements | Additional Information |
|---|---|---|
| Agent Remote | A type of FireScope agent data access where agent sends data back to the Edge device periodically vs. utilizing the polling service from the Edge device. | |
| Attribute Incoming | This is also referred to as a Dynamic Data Attribute (DDA) | |
| Attribute JSON Incoming | This is also referred to as a Dynamic Data Attribute (DDA) | |
| Calculated Attribute | You can use this attribute to combine other attributes’ values. Configuring a Calculated Attribute | |
| FireScope Agent | Agent must be installed on device. Currently available for most operating systems, including Windows, Linux, Unix, BSD. | This method offers the largest scope of information collection. It includes log data from any log file on the host machine as well as system performance data and direct database connectivity. See Installing an Agent. |
| LDAP Check | Requires CI to have a link to LDAP credential | Collect metrics using LDAP queries |
| NetApp Check | Requires CI to have a link to NetApp ONTAP credential | Collect metrics directly from a NetApp Filer using ONTAP API |
| Percentile Attribute | Value of other attributes at specified percentile for a specific time window in days. (information on percentile calculations) | |
| SNMP v1 | Device must be SNMPv1 compatible or have an SNMP agent installed. This includes most networked assets. |
The SNMPv1 SMI specifies the use of a number of SMI-specific data types, which are divided into two categories:
|
| SNMP v2 | Device must be SNMPv2 compatible or have an SNMP agent installed. |
The SNMPv2 SMI is described in RFC 2578. It makes certain additions and enhancements to the SNMPv1 SMI-specific data types, such as including bit strings, network addresses, and counters.
In SNMPv1, a 32-bit counter size is specified. In SNMPv2, 32-bit and 64-bit counters are defined. Additionally, SNMPv2 also specifies information modules, which specify a group of related definitions. Three types of SMI information modules exist: MIB modules, compliance statements, and capability statements.
|
| SNMP v3 | Device must be SNMPv3 compatible or have an SNMP agent installed. |
Essentially offers the same information as SNMPv2, with the addition of 3 important security features:
|
| TCP Check | Collects information by connecting via IP and Port. | |
| VM Guest | Requires CI to have a link to VM credential | Collects metrics regarding VM Guests |
| VM Host | Requires CI to have a link to VM credential | Collects metrics regarding VM Hosts |
| VM Virtual Center | Requires CI to have a link to VM credential | Collects metrics regarding VM Virtual centers |
| WMI Attribute | Requires CI to have a link to WMI Credential. | Retrieves the value of a property contained in a WMI class instance |
Attribute
An Attribute is a specific metric or log you wish to collect data for – such as CPU load average or response time – and is associated with a Configuration Item (CI). An Attribute can refer to a metric obtained via any of FireScope data collection methods. Attributes can be configured as the following value types:
| Value | Type | Description |
|---|---|---|
0 |
Float | Double e.g. 3.14 |
1 |
String | Character (max size 1024) e.g. “Hello world” |
2 |
Log | Actual lines from a log attribute / Windows Event log attribute (Max size 65535) |
3 |
Long | Integer e.g. 2147483647 |
4 |
Text | Very large “String” equivalent of a CLOB (Max size 65535) |
9 |
JSON |
JSON-formatted string, with max a size of 4096 characters. Example:
{"first_name":"Bryan","company_name":"FireScope"}
|
The easiest way to add Attributes for a CI is to associate the CI with a Blueprint. Blueprints are pre-configured CIs of a specific type – such as Windows Server or Cisco 2600 – and include a list of commonly used Attributes, Event Definitions, and Visual Controls. You can associate more than one Blueprint with a CI.
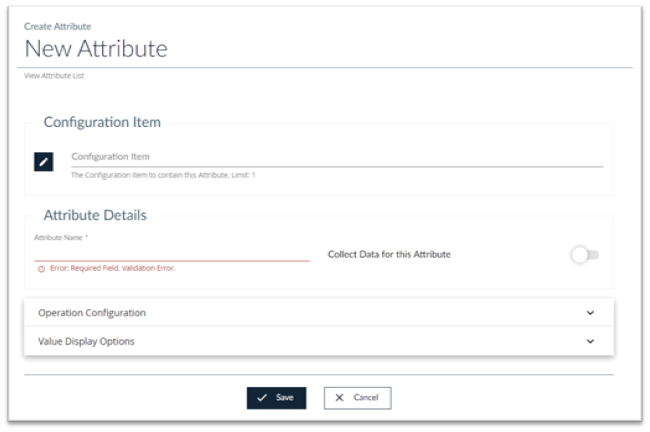
Create an Attribute:
- Log in to FireScope as a Configuration Administrator or FireScope Administrator.
- Navigate to Configuration > Attributes > Create and the New Attribute page displays.
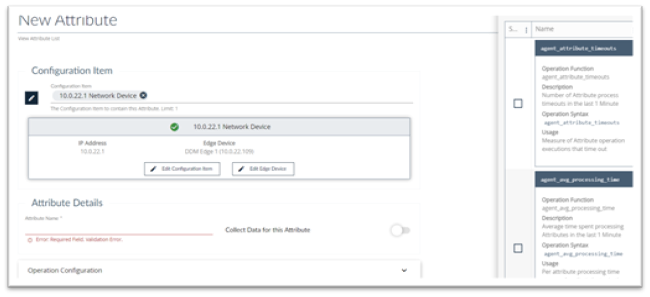
- Configuration Item: Click on the Edit button to select the Configuration Item you want to create the attribute for
- Attribute Name: Provide a name for this attribute
- Collect Data for this Attribute: If you want to begin collecting data on this attribute turn this on.
Operation Configuration Panel
Select Operation Configuration to display the Operation Configuration page.
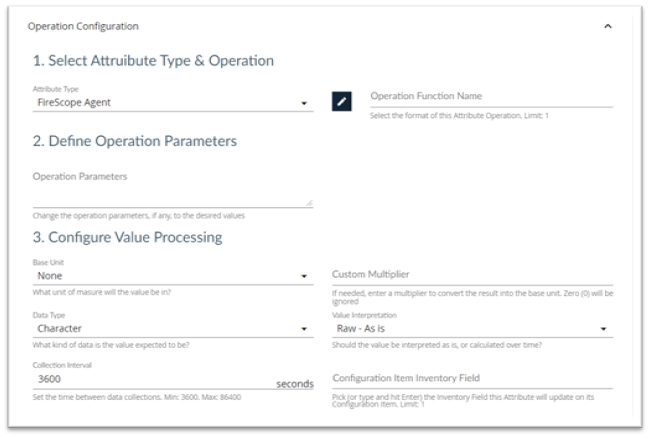
Select Attribute Type and Operation Section
- Attribute Type: Select the type of attribute you are creating from the list. See Attribute Types below.
- Operation Function Name: Click the edit button and select an Operation if needed.
Define Operation Parameters Section
Operation Parameters: If you selected an Operation Function it will appear here. You can leave it as is, or change the operation parameters, to the desired values.
Configure Value Processing Section
- Base Unit: Select the base unit from the list.
- Custom Multiplier: If needed, enter a value to be multiplied by the attribute value to convert the result into the base unit.
- Data Type: Select the Data Type from the list.
- Value Interpretation: Select the Value Interpretation from the list.
- Collection Interval: Set the time between data collections.
- Configuration Item Inventory Field: Type a value or select a value from the list.
Value Display Options Panel
Select Value Display Options to display the Value Display Options page.
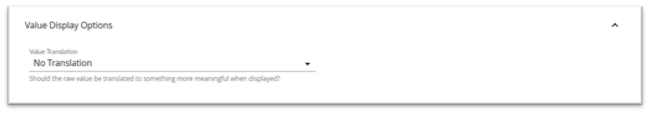
- Value Translation: Select an appropriate translation for this value if needed
To save time when configuring multiple similar CIs, use a Blueprint.
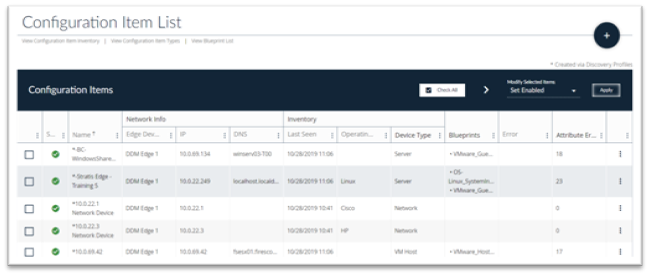
Attribute List
Navigate to Configuration > Attributes > List and the Attribute List page displays.
Edit, View or Delete an Attribute:
- Go to the far right of the row containing the Attribute you are interested in and click on the three dots to perform operations on this Attribute.
- If an Attribute is associated with a Blueprint, the Blueprint name precedes the Attribute name and not all fields are editable – such as the operation and type information. If you need to edit an Attribute associated with a Blueprint, select the Blueprint in the Configuration Field (step 3), and edit this Attribute.
- Edit the form. For more information about the Attribute fields, see Create Attribute.
- Click the Save button.
Attribute Types
Attribute Types defines how FireScope gathers values for an Attribute, it could be either through the FireScope Agent, SNMP or other means.
Agent Remote
In the case of Agent Remote Attributes, the Edge Device does not request the values from the Agent, instead the Agent periodically (as configured in the Agent Configuration File) retrieves the list of currently active Agent Remote attributes from the Edge Device. After retrieving the list of Agent Remote attributes, the Agent periodically sends the values for those Attributes back to the Edge Device.
Agent Configuration File refers to either firescope_agentd_posix.xml or firescope_agentd_win.xml file.
This functionality is configured with following two properties in the FireScope Agent Configuration File. The Agent should know which Edge Device has the list of agent remote attributes. This is configured in the Server property by adding the IP address of the Edge Device as the first entry in the command delimited list.
<prop>
    <key>Server</key>
    <value>10.0.12.64,10.0.12.61,10.22.121</value>
    <description> List of comma delimited IP addresses of FireScope servers. First entry is used for sending active checks.</description>
    <flags>0</flags>
</prop>
In the example above, the agent will only request a list of agent remote attributes from the edge device with the IP 10.0.12.64 because it is the first (or in most cases, only) IP in the list.
This FireScope Configuration Item's name should be set as the value for Hostname property. (Please note that the Hostname value is Case Sensitive)
<prop>
    <key>Hostname</key>
    <value>eas-cent67</value>
    <description>Unique hostname. Required for active checks and sentinel checks. For active checks, this unique host name must be same as the corresponding CI name.</description>
    <flags>0</flags>
</prop>
In order to make sure that everything is setup correctly, set the value of DebugLevel property as 5 in the Agent Configuration File. After everything is working correctly, change it to 2 for normal error reporting.
<prop>
    <key>DebugLevel</key>
    <value>5</value>
    <description>Debug level for FireScope Agent. 0 – none, 1 – critical, 2 – error (default), 3 – warnings, 4 – info, 5 – debug (max info) </description>
    <flags>5</flags>
</prop>
Verify the following two items inside the Agent log file: firescope_agentd.log:
First, this debug line indicates that that the Agent is requesting the list of Agent Remote attributes:
(Message sent: FSC_GET_ACTIVE_CHECKS) for the CI with the name “eas-cent67”.|DEBUG |2016-02-03|11:49:17|Thread[ 1495]|[TcpSenderReceiver.cpp:250]| Message sent: FSC_GET_ACTIVE_CHECKS eas-cent67
A few lines below the FSC_GET_ACTIVE_CHECKS line, you should see the list of agent remote attributes and their “operation” field displayed.
|DEBUG |2016-02-04|11:07:55|Thread[236223207096]| TcpSenderReceiver.cpp:146]| Received:agent_cpu_util:60:0:56b26a42ef134456164f344eagent_check:60:0:56b26de3ef13445e384f305c
In this case two operation are received which means there are two Agent Remote attributes configured for this CI: agent_cpu_util and agent_check.
Here is an example, along with the description of an Agent Remote Attribute.
| Operation | Description |
|---|---|
|
windows_eventvwr(logName[,filter])
For Microsoft Windows only, and is only available as a "Remote" type. |
Collects events from Microsoft Windows Event subsystem Parameters:
|
Example Windows Event Viewer Agent Remote Attribute
windows_eventvwr(security,Type:Information|Source:Microsoft Windows security|Category:12800|EventID:5156|Domain:firescope|User:N/A|Computer:N/A|Message:Junk)
Application Logs
Before You Begin
- Install the FireScope Agent on the asset where the log file is stored.
- Ensure that the FireScope Agent has access to the asset’s file system in order to read the log file.
- Create a CI for the asset. For more information, see Creating a Configuration Item.
Log in to FireScope as a FireScope or Configuration Administrator.
Click Configuration > Attributes > Create and the New Attribute page is displayed.
- Configuration Item:, Click the Edit button and select the CI you want to create the Attribute for.
- Attribute Details: Provide a name for your log file.
Select Operation Configuration to display the Operation Configuration page

In the Data Collection Settings section
- Attribute In Type, select Agent Remote.
- Operation Function Name:, enter filesystem_logreader(<path to log file>, <optional parameters>). Refer to the table below for an example.
- Complete the rest of the page as needed. For more information about the Attribute fields, see Creating an Attribute.
- Click Save. All log entries for this asset will now be collected, associated with this Attribute, and stored as text-based data.
Examples:
filesystem_logreader(/var/log/boot.log,ORA,1234)
filesystem_logreader(C:\Windows\setuplog.txt)
Attribute Incoming & Attribute JSON Incoming
Creating the TCP Message
To use the Dynamic Data Attributes (DDA), you must send a TCP message via port 8043, with the following tags and variables. The message format will differ depending on the type of DDA you want to use (see the subsequent sections).
| Tag/Variable | Description |
|---|---|
FSCP_PAYLOAD# |
Alerts FireScope that the following is an fs_incoming message.This tag is required to start an inbound message. |
<ATTRS></ATTRS> |
Denotes multiple Attributes. Include <ATTRS> before the first <ATTR> tag and </ATTRS> after the last </ATTR> tag. |
<ATTR></ATTR> |
Denotes an Attribute. |
CIname |
Name of the required CI. |
operation |
Unique operation of the Attribute for this CI (i.e., fs_incoming(status) where status can be replaced with any descriptive and unique value for the Attribute to collect). |
value |
Value of the Attribute (e.g., 42, “Success”), which must match the data type of the Attribute that is in the template (e.g., JSON, integer, float, character). |
timestamp |
Time stamp value of the actual time (seconds from epoch) that the value sample occurred. Timestamp is optional. When timestamp is omitted, the time FireScope received the value is used. |
JMX Monitoring
The figure below details a simple FireScope appliance monitoring two hosts, each of which houses two Java applications
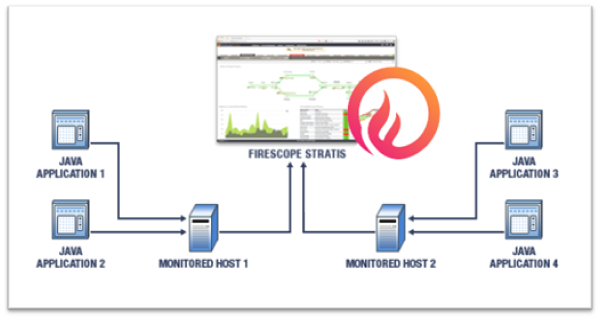
The following points highlight the necessary steps required for JMX monitoring with FireScope:
- Configure your Java virtual machine (JVM) to allow access to its MbeanServer.
- Use JConsole if necessary to discover deployed Mbean names, attribute names and operation names.
- Create new UserParameters in your remote FireScope agent which will in turn make invocations through the jmxdelegate.jar file to interact with your targeted JMX beans.
- Create items on the FireScope server which reference the newly created UserParameters.
JVM Configuration
Each JVM that will be monitored must be configured to allow access to the JMX server that runs inside of each monitored JVM. Configuration is accomplished by providing a few system parameters to the JVM upon application startup. The parameters are listed below along with their description.
| Parameter | Value Type | Example | Description | Required |
| com.sun.management.jmxremote | None | Instruct the JVM to enable remote JMX access | Yes | |
| com.sun.management.jmxremote.port | Numeric | 3900 | Server port that JMX server allows access on. | Yes |
| com.sun.management.jmxremote.authenticate | Boolean | 0 | Currently authenticated access is not supported. | Yes |
Example:
/java -Dcom.sun.management.jmxremote -Dcom.sun.management.jmxremote.port=3306 -Dcom.sun.management.jmxremote.authenticate=false
Some warnings:
- Each configured Java virtual machine must use a separate port configuration.
- Configured ports must not conflict with any ports currently in use on the system being configured.
- Use netstat to ensure valid selection of configured ports.
- On Unix / Linux systems use ports > than 1000
Use netstat prior to starting or restarting your application to ensure that the configured port is not in use. Restart your Java application using the new configuration. Then run netstat again to ensure that the system reports a listening port on the selected configuration port.
JMX Discovery
JConsole is a JVM monitoring application that has been in existence since the release of Java JDK 1.5.x. With JConsole it is possible to explore all JMX managed beans in a virtual machine once the JVM is configured to allow JMX remote access as described above. The JConsole executable can be found in the bin directory for your JDK1.5.x or greater installation.
Launch JConsole and select the “Remote Process” option button. Enter localhost:in the entry text box, where the port is the configured JMX listener port. Then select the “Connect” button.
Once started, JConsole will display several tabs. Select the “Mbeans” tab. Along the left hand side is a tree view that lists each deployed Mbean in the JMX Managed Bean Server. The treeview allows exploring down to each Mbean and displays each Mbean attribute or operation. Once you have navigated down to the bean level JConsole will display the Mbean name in the display on the right hand side.
Some notes:
- JConsole is not required for use with the FireScope monitoring. It is described here for the user’s understanding and for exploring beans deployed to your Mbean server.
- JConsole is part of the JDK download, not the JRE.
- All Mbeans are uniquely identified by name.
- In order to access the attributes or operations of an Mbean you must reference the bean using its unique name.
- In order to maintain uniqueness in names servers such as Tomcat and JBoss, use complex nested names.
Individual JMX Attribute Access
FireScope makes available a client access tool called jmxdelegate for querying and setting individual Mbean attributes and invoking Mbean operations. As described above, the JConsole utility can be used to determine the names and attributes of Mbeans deployed in a particular java virtual machine. The bean names, attributes names and operation names are passed to the jmxdelegate tool for access.
First deploy the jmxdelegate.jar file to an appropriate location on your monitored system. The following example uses a bean names from a system that has a default Tomcat version 6.0.13 deployed running and configured for JMX access.
The jmxclient tool uses the following command format:
/java -Dhost= -Dport= -DbeanName= -Dattribute= -Dparameters= -DnestedResult= -jar /jmxdelegate.jar
| Parameter | Required | Description |
|---|---|---|
/java |
Yes | Path to the Java VM executable file |
-Dhost |
Yes | Host for JMX access. Typically is localhost. |
-Dport |
Yes | Port for JMX access. |
-DbeanName |
Yes | Name of the managed bean of interest obtained via JConsole. |
-Dattribute |
No | Name of the manager bean attribute or operation of interest obtained via JConsole. |
-Dparameters |
No | The attribute or operation parameters if any |
-DnestedResult |
No | The name of a sub-element in a Composite Result. |
The following example command line will retrieve the requestCount? Attribute from the deployed tomcat manager application that comes as a part of the standard Tomcat deployment:
/java -Dhost=localhost -Dport=3306 -DbeanName=Catalina:j2eeType=Servlet,name=HTMLManager,WebModule=//localhost/manager,J2EEApplication=none,J2EEServer=none -Dattribute=requestCount -jar jmxdelegate.jar
Note the nested / complex bean name created by Tomcat shown again as follows:
Catalina:j2eeType=Servlet,name=HTMLManager,WebModule=//localhost/manager,J2EEApplication=none,J2EEServer=none
Invoking the above command returns the current requestCount.
Now invoke the manager via a web browser as follows: http://localhost:8080/manager/html
Then re-invoke jmxclient tool to show that the request count increases with each manager invocation.
Example of FireScope JMX Managed Beans
The FireScope solution is delivered with an application called SyslogListener. The SyslogListener application receives syslog messages over TCP/IP and transfers these messages to the FireScope database. The SyslogListener application contains a few managed beans which expose some data points which may be of interest to FireScope users. The exposed beans are described in the following table:
| Bean Name | Bean Attribute / Operation | Description |
|---|---|---|
| com.firescope.sysloglistener:name=ReceiveMessageCount | PerMinuteMessageCount | Number of messages received during the last minute of operation |
| com.firescope.sysloglistener:name=ReceiveMessageCount | DailyMessageCount | Cumulative number of messages received since midnight |
| com.firescope.sysloglistener:name=PersistedMessageCount | PerMinuteMessageCount | Number of messages saved during the last minute of operation |
| com.firescope.sysloglistener:name=PersistedMessageCount | DailyMessageCount | Cumulative number of messages saved since midnight |
| com.firescope.sysloglistener:name=MessageExecutionTime | DurationMilliSeconds | Processing time in milliseconds for the last received message |
| com.firescope.sysloglistener:name=DatabaseRefresher | ForceDatabaseRefresh | Force all queries to re-issue queries for the next message |
Accessing the FireScope managed beans can be accomplished via the following jmxclient invocations:
/java -Dhost=localhost -Dport=3306 -DbeanName=com.firescope.sysloglistener:name=ReceiveMessageCount -Dattribute=PerMinuteMessageCount -jar jmxdelegate.jar
/java -Dhost=localhost -Dport=3306 -DbeanName=com.firescope.sysloglistener:name=ReceiveMessageCount -Dattribute=DailyMessageCount -jar jmxdelegate.jar
/java -Dhost=localhost -Dport=3306 -DbeanName=com.firescope.sysloglistener:name=PersistedMessageCount -Dattribute=PerMinuteMessageCount -jar jmxdelegate.jar
/java -Dhost=localhost -Dport=3306 -DbeanName=com.firescope.sysloglistener:name=PersistedMessageCount -Dattribute=DailyMessageCount -jar jmxdelegate.jar
/java -Dhost=localhost -Dport=3306 -DbeanName=com.firescope.sysloglistener:name=MessageExecutionTime -Dattribute=DurationMilliSeconds -jar jmxdelegate.jar
/java -Dhost=localhost -Dport=3306 -DbeanName=com.firescope.sysloglistener:name=DatabaseRefresher -Dattribute=ForceDatabaseRefresh -jar jmxdelegate.jar
The managed beans listed above will not appear or be available until after the SyslogListener has received at least 1 message.
FireScope JMX Agent Configuration
The following list outlines prerequisites for enabling FireScope JMX monitoring on remote hosts:
- A valid Java runtime (JRE) must be deployed and available on the remote host
- The jmxdelegate.jar file must be deployed and executable on the remote host.
- UserParameters must be defined and added to the agent configuration file on the remote host.
- The remote agent must be restarted
- It is recommended that the new UserParameter be tested on the remote host
For the purposes of this example we shall assume each of the following has been configured as described below:
- A Java VM has already been configured for JMX access on port
4900 - A Java executable exists in the path
- The
jmxdelegate.jarfile has been deployed to/jarsdirectory - Our new user parameter shall be called
java.application.monitored.value - Our JMX bean name is called
application.MBean - The property of interest on this Mbean is called
property
To configure our new user parameter we edit the agent configuration file by adding the following line:
UserParameter=java.application.monitored.value,java -Dhost=localhost -Dport=4900 -DbeanName=application.MBean -Dattribute=property -jar /jars/jmxdelegate.jar
FireScope JMX Server Configuration
Create a Configuration Item (CI) that references the UserParameter that was created in the previous section. See Creating a Configuration Item.
JMX Enabling Your Own Java Applications
The code listed below describes the steps necessary to make your applications JMX capable. The process covered outlines only standard Mbeans. For more information regarding other typs of Mbeans such as MXBeans, or DynamicBeans refer to the JMX API documentation or Java tutorial.
For any class that you wish to make available to JMX you must write an Mbean interface that lists the available JMX methods. The Mbean interface name must have the same prefix name as the implementing class.
public interface ExecutionMessageCounterMBean {
    public long getPerMinuteMessageCount();
    public long getDailyMessageCount();
}
Then provide an implementation for the above interface such as the following package example:
import java.util.Calendar;

public class ExecutionMessageCounter implements ExecutionMessageCounterMBean
{
    private int lastIndex;
    private long[] perMinuteMessageCount;

    public ExecutionMessageCounter()
    {
        super();

        lastIndex = 0;
        perMinuteMessageCount = new long[1440];
    }

    public long getPerMinuteMessageCount()
    {
        int perMinuteMessageCountIndex = getMinuteIndexNow();

        return perMinuteMessageCount[perMinuteMessageCountIndex];
    }

    public long getDailyMessageCount()
    {
        long dailyMessageCount = 0;

        for(long oneMinuteCount : perMinuteMessageCount) {
            dailyMessageCount += oneMinuteCount;
        }

        return dailyMessageCount;
    }

    private synchronized int getMinuteIndexNow()
    {
        Calendar calendar = Calendar.getInstance();
        int resultIndex = calendar.get(Calendar.HOUR_OF_DAY) * 60 + calendar.get(Calendar.MINUTE);

        return resultIndex;
    }
}
Now register your managed bean with the local Mbean server. Each bean must be registered using a unique name. For purposes of this example we shall use the domain of example and a name of MessageCounter as shown below:
ExecutionMessageCounter counter = new ExecutionMessageCounter();
MBeanServer mBeanServer = ManagementFactory.getPlatformMBeanServer();

try {
    ObjectName objectName = new ObjectName("example:name=MessageCounter");
    mBeanServer.registerMBean(counter, objectName);
}
catch(Exception exception)
{
    // Add appropriate exception handling
}
LDAP Check
Before you can create LDAP Check attributes, you should define appropriate credentials to be used to execute the LDAP Queries.
Once you have working LDAP credentials attached to the CI, you can create the LDAP check attributes. Only attributes of CI’s associated to an LDAP credentials will be able to collect LDAP data. Click on create button on the upper right hand corner of the Attribute page. Note: Make sure appropriate CI is selected.
In the Data Collection Settings section select LDAP Check from the Type drop down list.
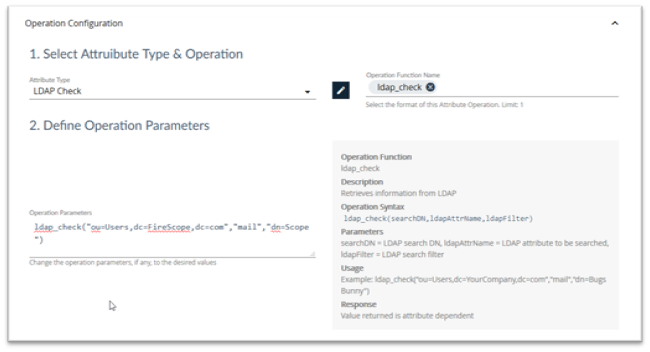
Click on the Select Operation button and click on ldap_check. This will give you the syntax and examples for this attribute.
| Operation | Description |
|---|---|
|
ldap_check(searchDN,ldapAttrName,ldapFilter)
|
Retrieves information from LDAP Parameters:
|
Example LDAP Check Attribute Operation
ldap_check(“ou=Users,dc=YourCompany,dc=com”,”mail”,”dn=Bugs Bunny”)
When defining the LDAP query ensure that you retrieve information which you can use as an attribute. For example, If you wanted to test if any account that begins “SVC-“ is locked out, you could write an LDAP query to simply return true or false, but it may well be more useful to write one which returns a list of those accounts which are locked out. This way, when you add this to a notification, the recipient knows which account(s) to investigate.
As an example the following LDAP_Check attribute returns a list of accounts starting “SVC-“ which are currently locked out:
ldap_check(“CN=Users,DC=firescope,DC=com”,”cn”,”(&(cn=SVC-*)(lockoutTime>=1))”)
Finish the Attribute configuration:
- Select appropriate data type returned from the query from Type of Information dropdown list. In the above example it would be character.
- Set the Update Interval.
- Click Save.
NetApp Checks
| Operation | Description | Examples |
|---|---|---|
|
netapp_capacity(algorithm)
|
Returns the latest filer capacity for the specified algorithm Parameters:
|
netapp_capacity(totalSpareCapacity) Returns the capacity of all spares on the filer. |
|
netapp_disk(aggregateName, diskUid, diskKey)
|
Returns the latest disk stat value for the specified Parameters:
|
netapp_disk(aggr0,5000CCA0:0996A808:00000000:00000000:00000000:00000000:00000000:00000000:00000000:00000000,rpm) Returns the |
|
netapp_perf(object, instance, counter)
|
Returns the latest counter value for the specified object and instance. Parameters:
|
netapp_perf(system, system, http_ops) Returns number of |
|
netapp_snapshot(volumeName, snapshotName, snapshotKey)
|
Returns the latest snapshot stat value for the specified Parameters:
|
netapp_snapshot(vol0,hourly.0,total) Returns |
|
netapp_snapshot_aggregate(volumeName, snapshotKey)
|
Returns the latest aggregate snapshot stat value for the specified Parameters:
|
netapp_snapshot_aggregate(vol0,total) Returns |
|
netapp_spare(diskUid, diskKey)
|
Returns the latest spare disk stat value for the specified Parameters:
|
netapp_spare(5000CCA0:0996A808:00000000:00000000:00000000:00000000:00000000:00000000:00000000:00000000,rpm) Returns the |
|
netapp_volume(volumeName, volumeKey)
|
Returns the latest volume stat value for the specified Parameters:
|
netapp_volume(vol0,size-used) Returns the number of bytes used on |
Percentile
Use FireScope's Percentile Attributes to run percentile scoring over a time-limited set of historical values for a specific Attribute Operation.
| Operation | Description | Examples |
|---|---|---|
|
percentile_attribute(operation,days_in_period,percentile)
|
Value of other attributes at specified percentile. Parameters:
|
percentile_attribute("netapp_volume(vol0,size-used)",30,95)
Returns the 30-day, 95th percentile of the netapp_volume() attribute operation on this CI. |