Blueprint Graphs
Overview
|
Available with Events & Monitoring, use FireScope's Graphs to plot and chart Attribute values over time, or relative to each other. Create a Blueprint Graph to compare a set of 1-5 Blueprint Attributes to each other, and propagate a Graph to all Configuration Items (CIs) linked to the Blueprint. Use regular Graphs with 1-5 Attributes from up to 5 different CIs to compare across CIs with parallel bar, stacked bar, pie, donut, gauge, and multi-axis line styles. Add Annotation Markers at specific values for individual Attributes on Bar and Line Graphs, and automatically see Maintenance Windows added to the line Graphs as well. Then get a preview of the Graph with current Attribute values anywhere the Graph is seen in the application. |
List View
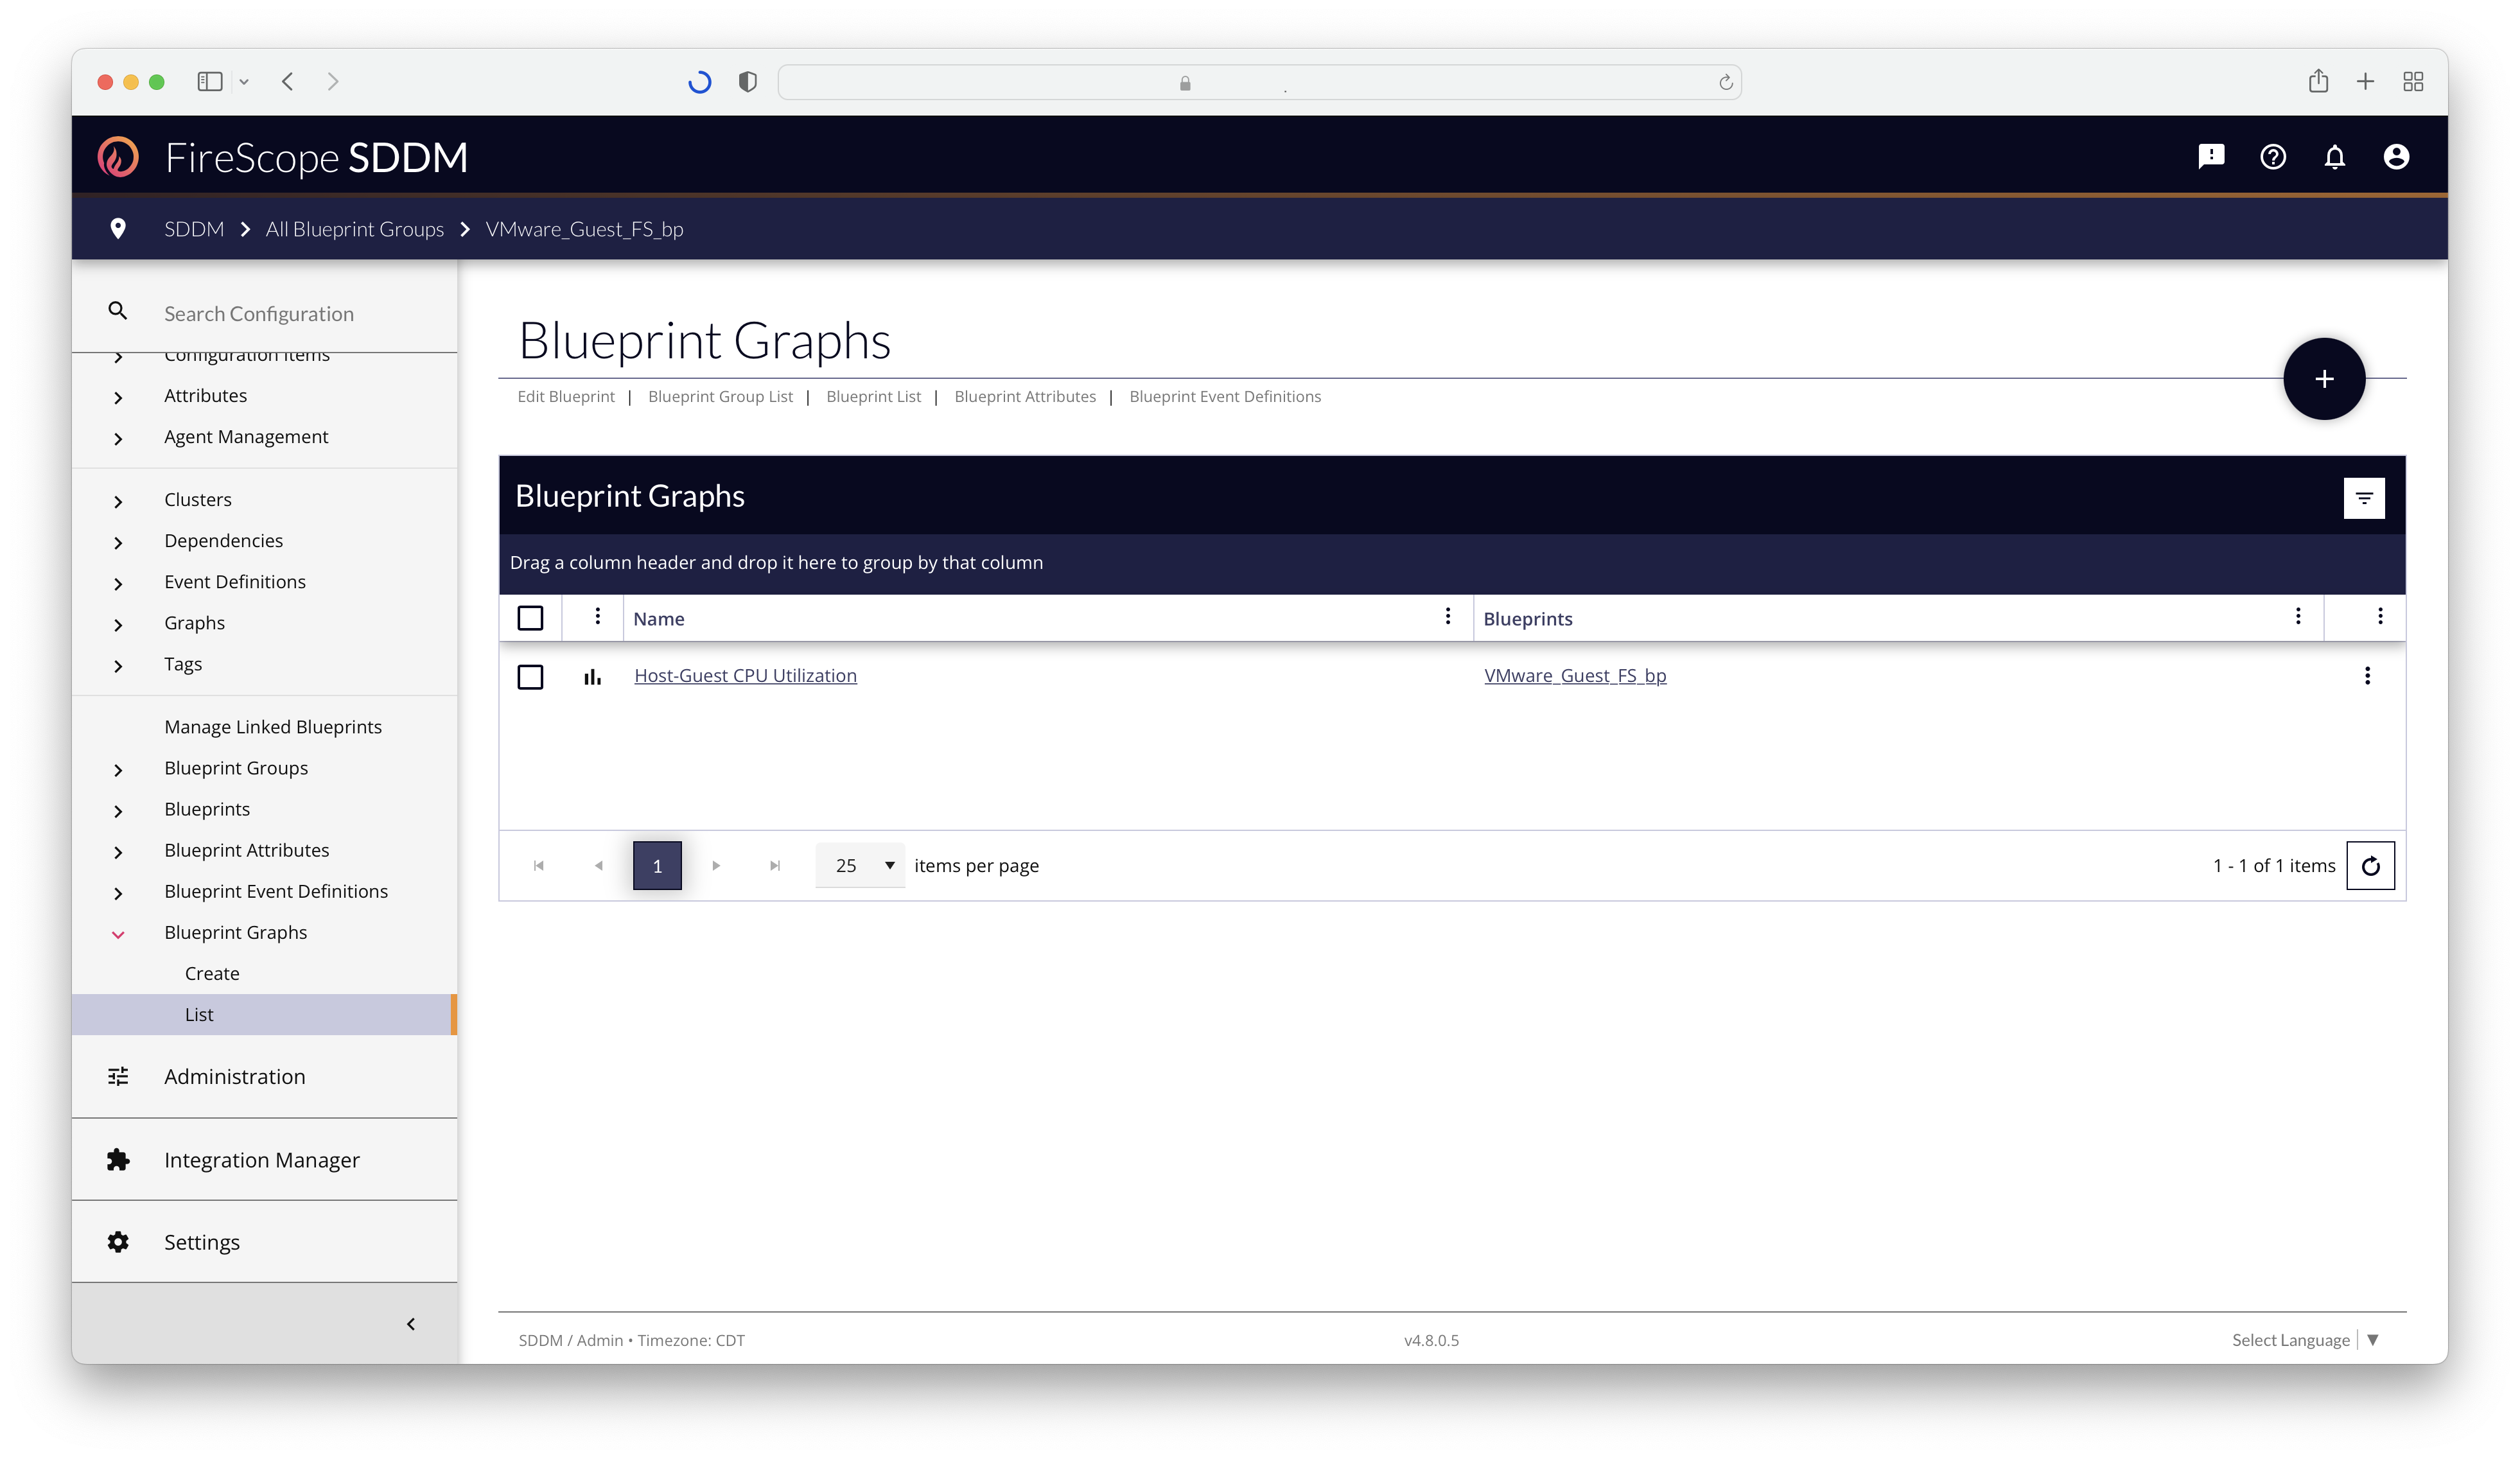
A FireScope Configuration Administrator or higher can find the Blueprint Graphs List Configuration > Blueprint Graphs > List. Each Blueprint Graph is associated to a Blueprint, meaning the Blueprint Graph List can be filtered down by selecting the Blueprint Group and Blueprint from the Omnibar at the top of the page. All Blueprint Graphs containing Blueprint Attributes from the resulting Blueprint or group of Blueprints will be listed.
List Context Menu Items
|
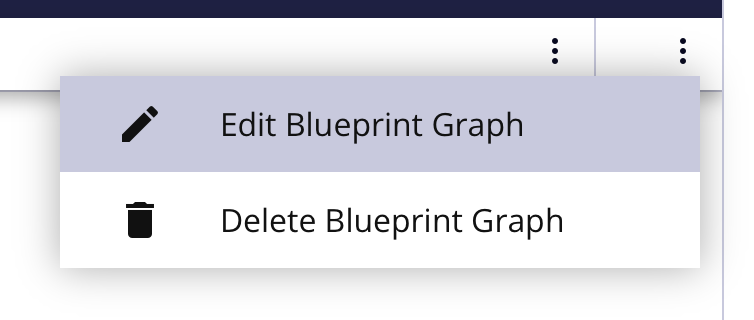
In the far-right column of the List view, there is a context menu for each Blueprint Graph with the following items:
If a Blueprint Graph cannot be modified, a context menu may not be offered |
 |
Edit Form
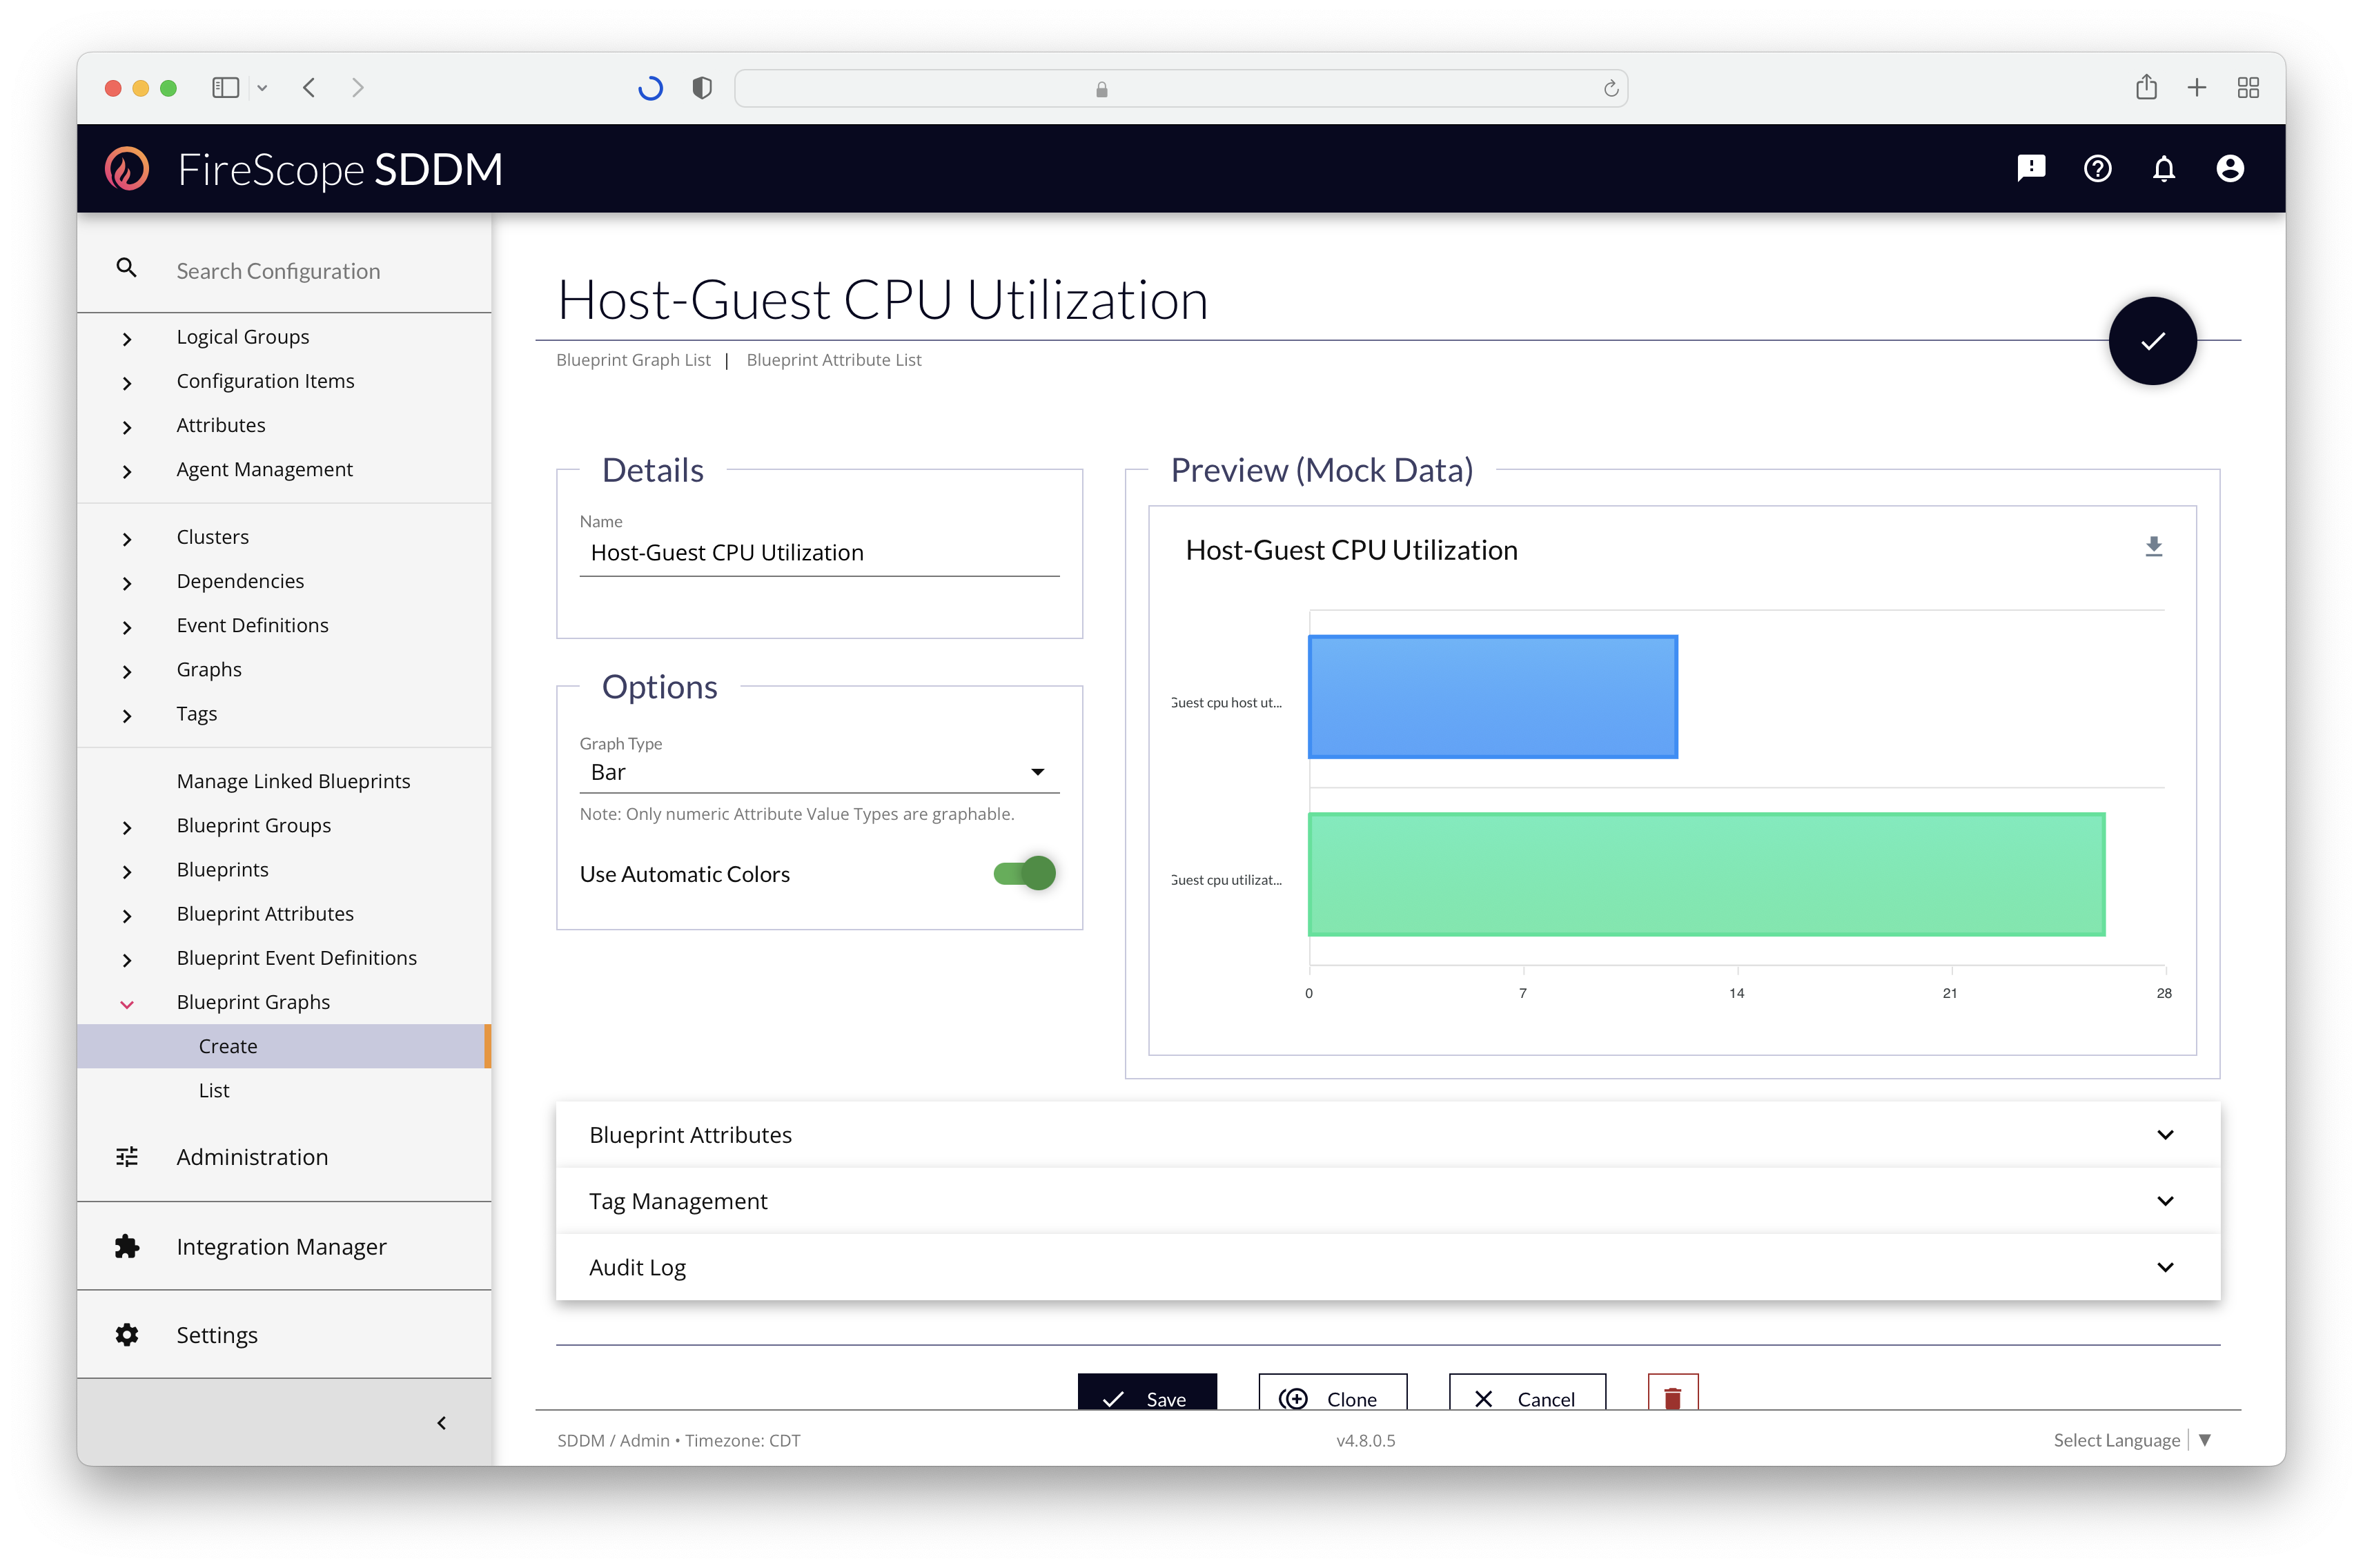
When creating a Blueprint Graph, only Blueprint Attributes that return numeric values (Value Types: Numeric or Float) can be used. Additionally, only 5 Blueprint Attributes can be added to a single Blueprint Graph due to performance and presentation considerations.
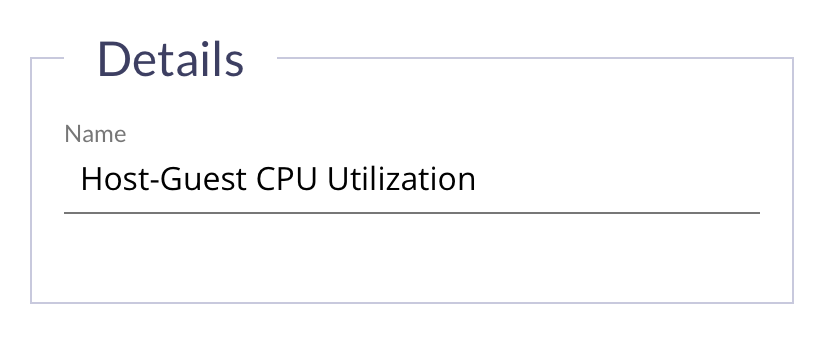
Details Section
| Form Field | Description | Required? |
|---|---|---|
| Name | Enter a name for the Blueprint Graph. It must be unique in the Blueprint. | Yes |
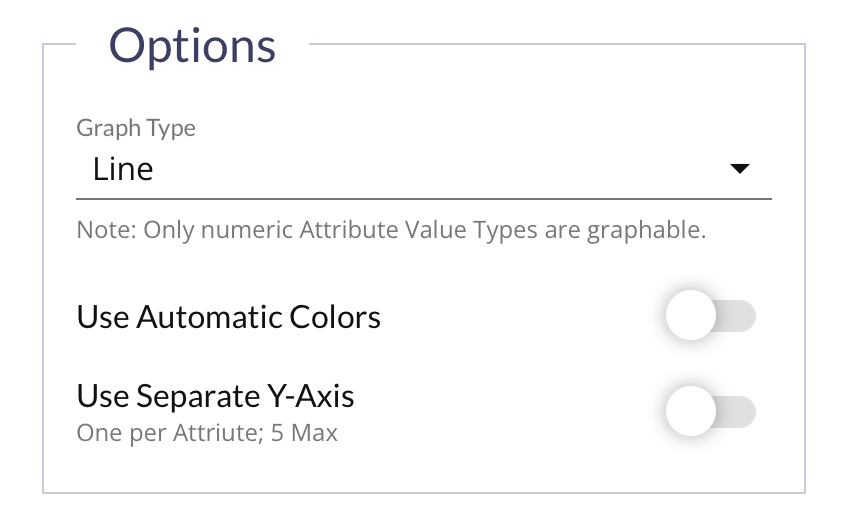
Options Section
| Form Field | Description | Required? |
|---|---|---|
| Graph Type |
Choose the type of Blueprint Graph to display:
|
Yes |
| Use Automatic Colors |
Let the application choose the best color for each data series? Default On for new graphs, Off for editing existing graphs. This will be automatically turned off after initial creation to store and persist colors through edits and changes to Blueprint Attribute selection/order. It can be turned back on to reassign colors during these subsequent edits to the Blueprint Graph. Turn Off to manually select each Blueprint Attribute's color with a color picker in the Attribute Panel:
|
No |
| Use Separate Y-Axis |
Only for Line Graph Types. Default Off. Turn On to add a separate Y-Axis for each Blueprint Attribute in the Blueprint Graph. |
No |
Preview (Mock Data) Section
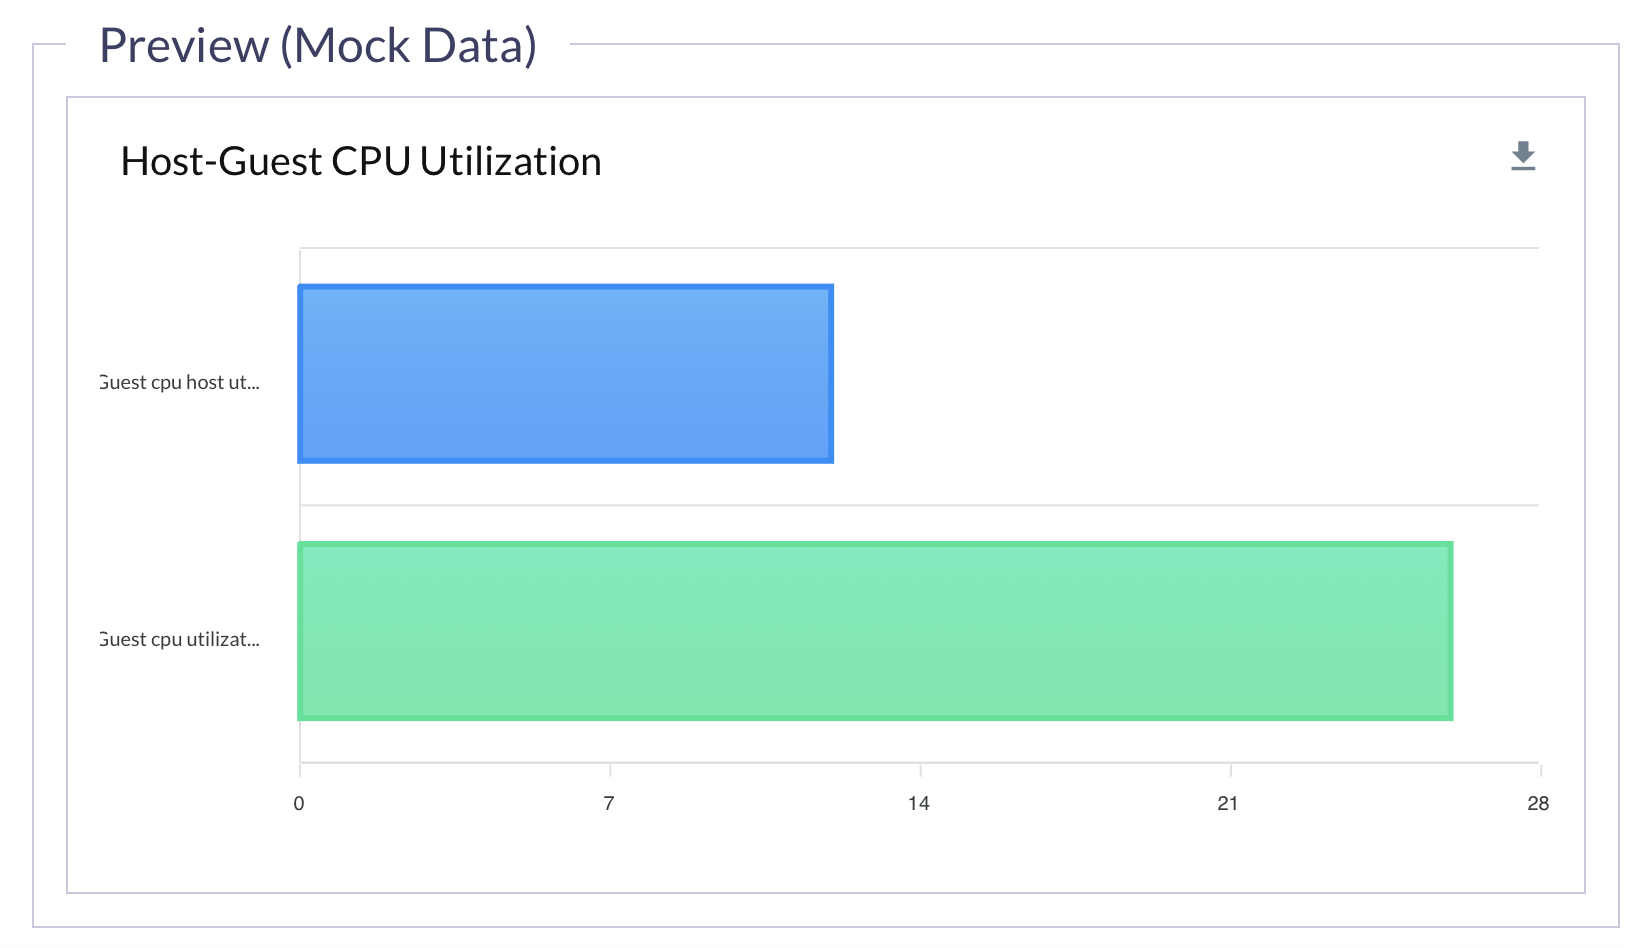
Blueprint Attributes do not collect data themselves. In order to give a sense of what the resulting graph would look like, "mock data" is used to fill up the same number of collected values for the same period based on collection interval for each Blueprint Attribute.
The mock data used bears a resemblance to the corresponding Blueprint Attribute in "collection interval" only. It does not take into account likely values, nor min/max potential values. View actual Attributes generated by the Blueprint Attribute to get a better sense of the range an Attribute Value may have when plotted, and use this information for setting Annotation Markers, sort order, and color/line style.
Attributes Panel
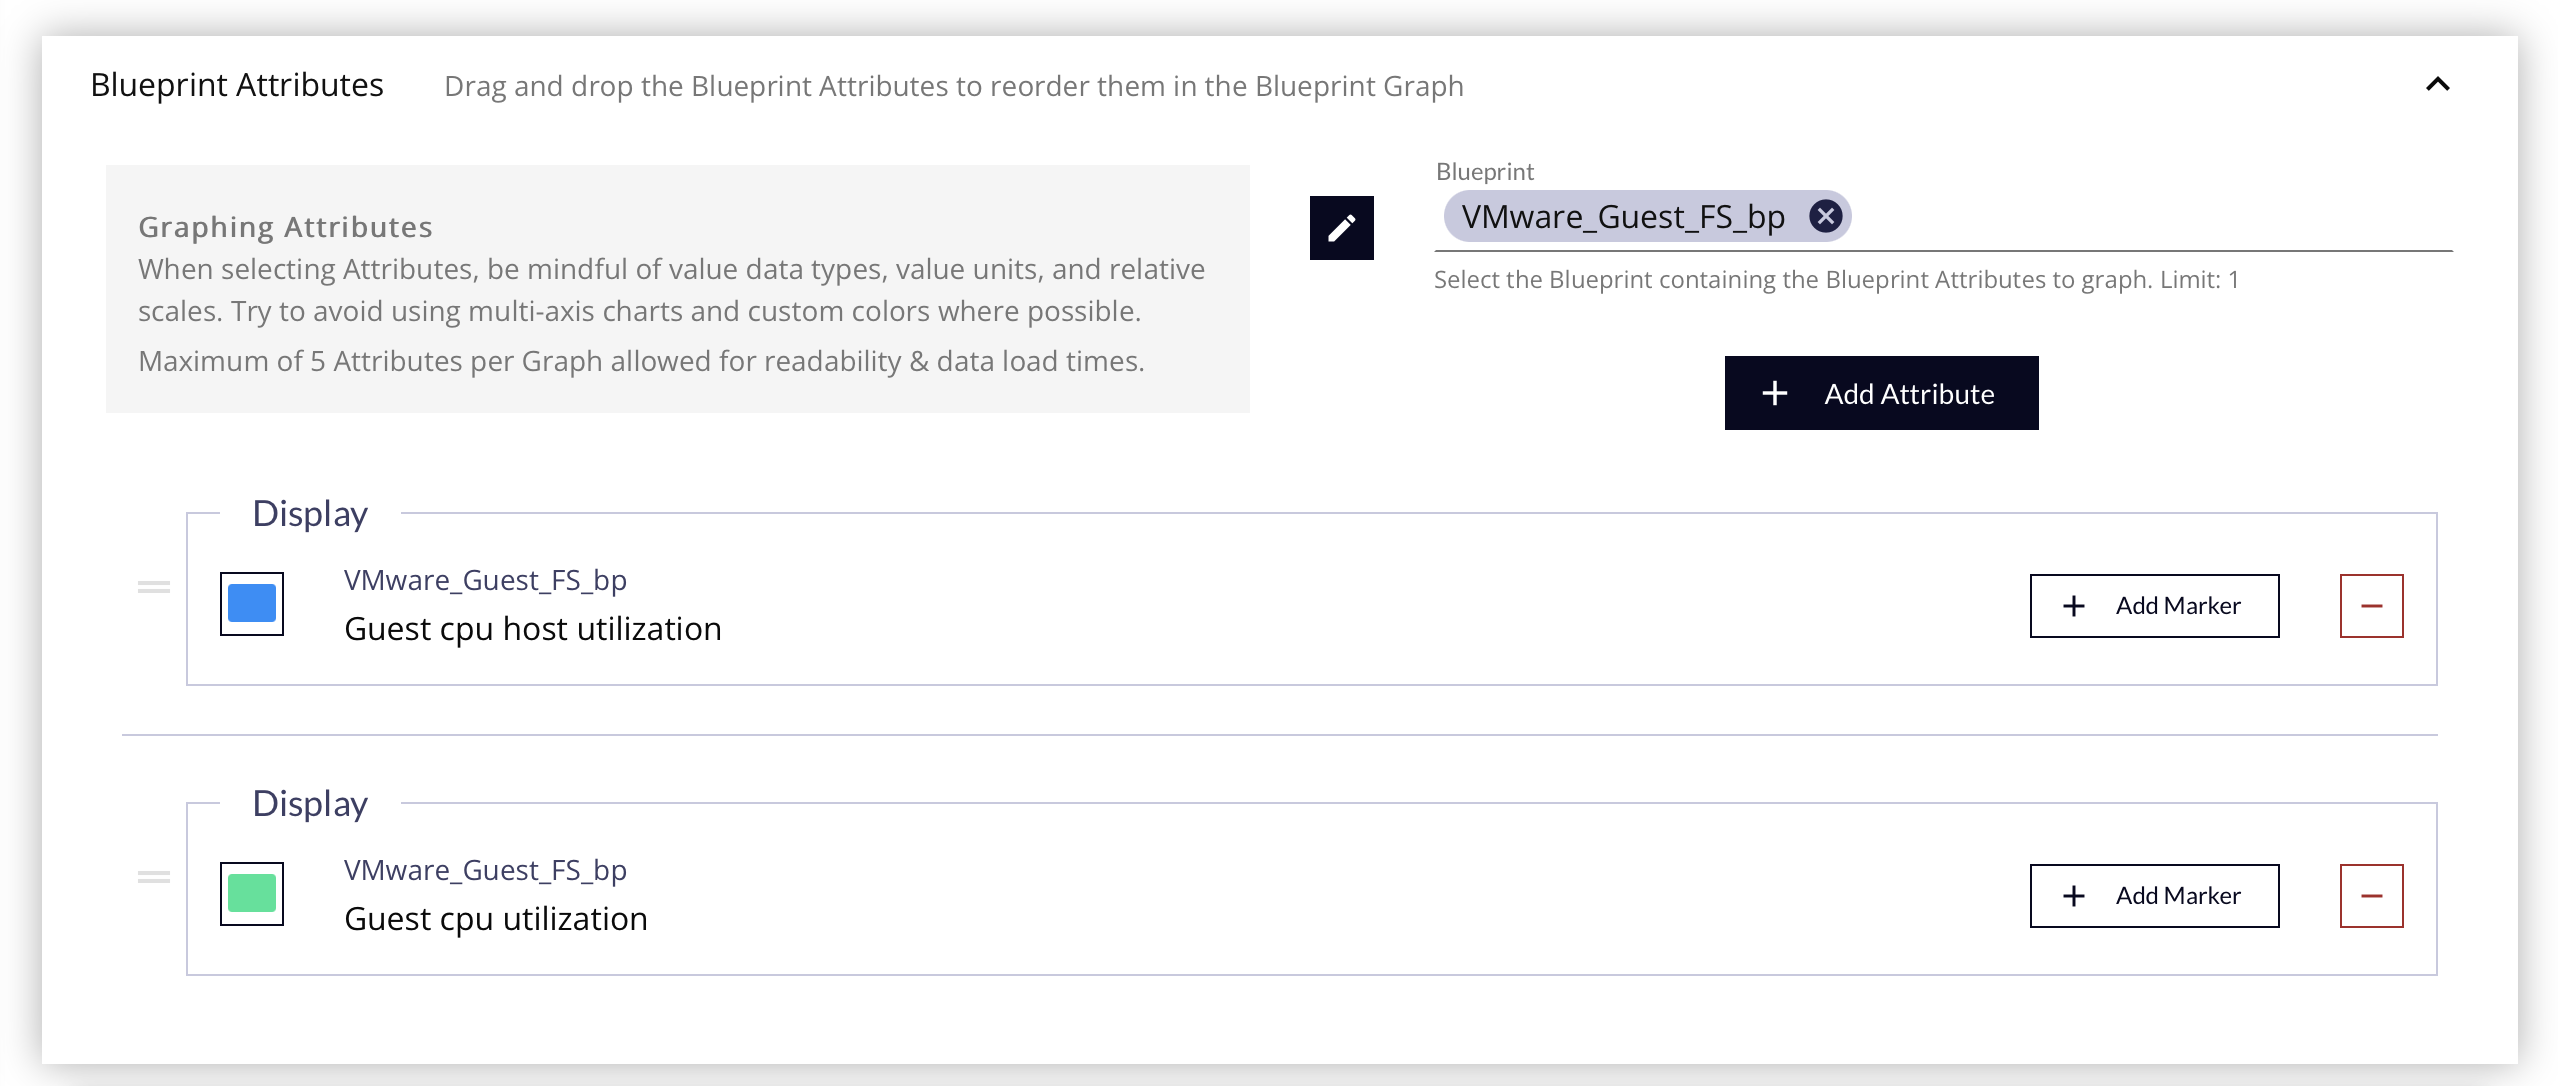
Only Attributes that have a numerical value type assigned (integer or float data) can be used in Graphs.
To add Blueprint Attributes to the Graph:
- Click the Edit button on the Blueprint field to reveal the Blueprint Picker Drawer.
- Mark the Blueprint to pull Blueprint Attributes from.
- Click the Add Attribute button to reveal the Blueprint Attribute Picker Drawer.
- Mark the Blueprint Attributes to use in the Blueprint Graph.
A maximum of 5 Blueprint Attributes can be on the same Blueprint Graph.
Use to select several Blueprint Attributes in a series, mark the first checkbox, and hold the SHIFT key when clicking the last checkbox.
Customizing Blueprint Graph Attributes
Below is an example of a single Blueprint Attribute, with a single Annotation Marker used to mark a value of 40 as a Warning threshold (visible with the Bar & Line Graph Types), and the Line Style customization options (visible with only Line Graph Types).
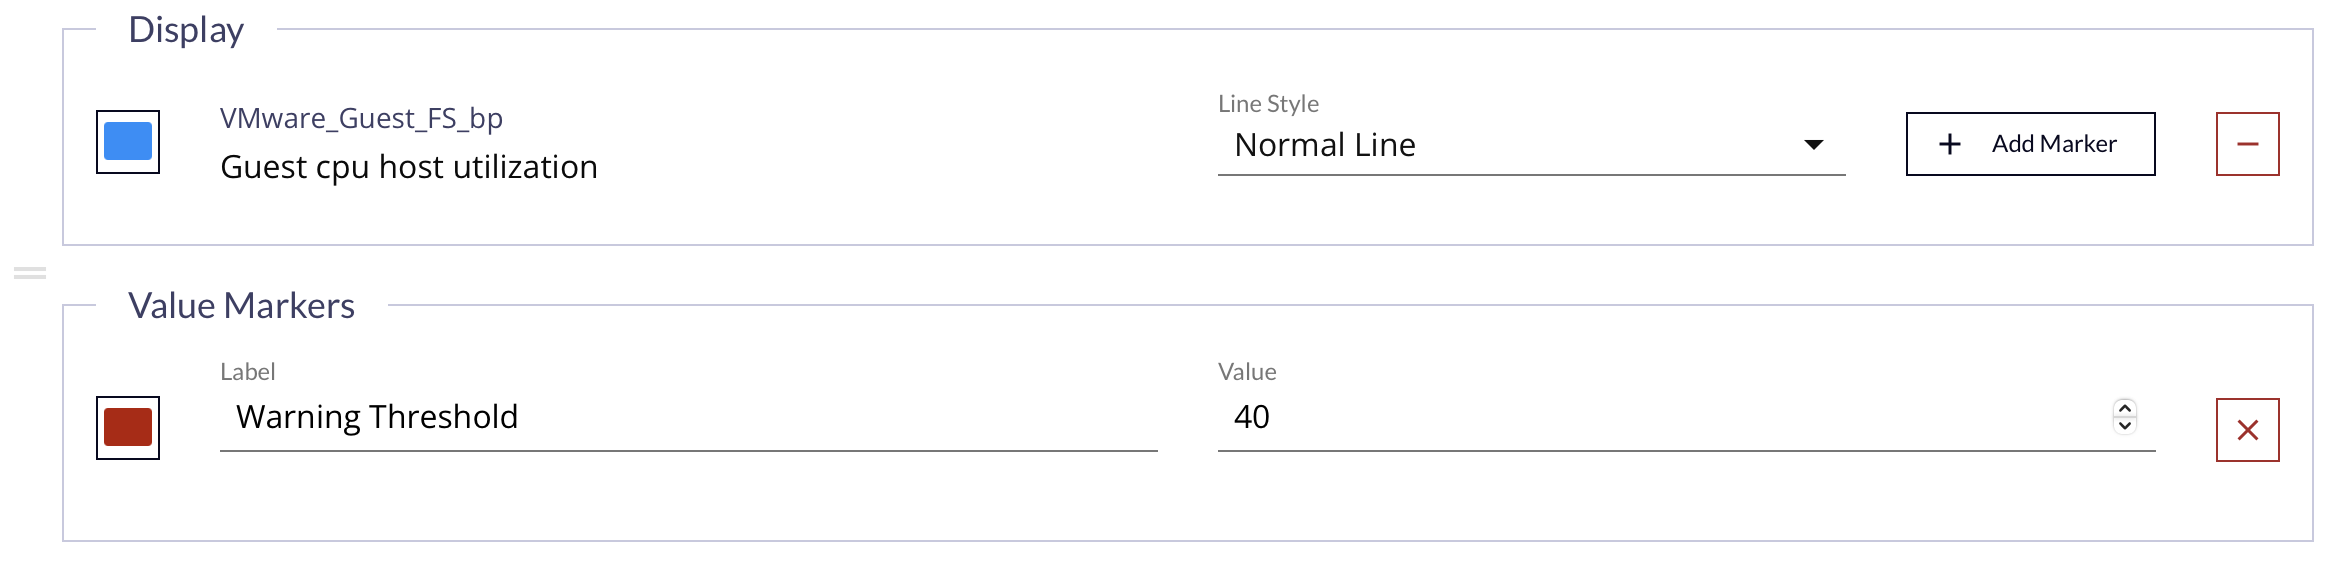
| Form Content / Field | Description | Applicable Graph Types |
|---|---|---|
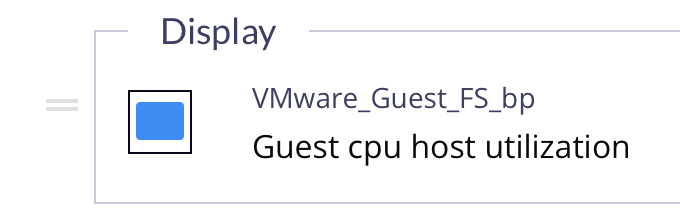
| Attribute Color Picker |
If not using Automatic Colors, choose the color to represent the Blueprint Attribute in the Blueprint Graph. Be sure to choose colors that are visually distinct from the other colors used in the Graph for readability. |
All |
| Blueprint & Blueprint Attribute Information | The name of the Blueprint is placed on top of the name of the Blueprint Attribute. | All |
| Line Style |
Choose the type of line to represent this Blueprint Attribute in the Blueprint Graph:
|
|
| Add Marker Button | Click the Add Marker button to put an Annotation Marker on the Blueprint Graph for this Blueprint Attribute. See Adding Annotation Markers below. |
|
| Remove Blueprint Attribute Button | Click the Remove Blueprint Attribute button to remove this Blueprint Attribute and associated Annotation Markers from this Blueprint Graph. | All |
Adding Annotation Markers
For Bar, Bar (Stacked), and Line Graph Types Annotation Markers can be added to the chart at specific values.
Annotation Markers are assigned to specific Blueprint Attributes due to multi-axis support.
- For Line Graph Type, if using multiple Y-Axes, the annotation will be added on the specific Blueprint Attribute's Y-Axis value position.
- For both Bar Graph Types, the annotation will be placed on the X-Axis value position, which is visually shared by all Blueprint Attributes.
| Form Content/Field | Description |
|---|---|
| Annotation Color Picker | Choose the color for the Annotation Marker line & flag outline |
| Label | Set the text of the Annotation Marker. Make it short and concise. |
| Value | Enter a number where the annotation should be drawn. |
| Remove Annotation Button | Click the Remove Annotation button to remove it from the Graph |
Tags Panel
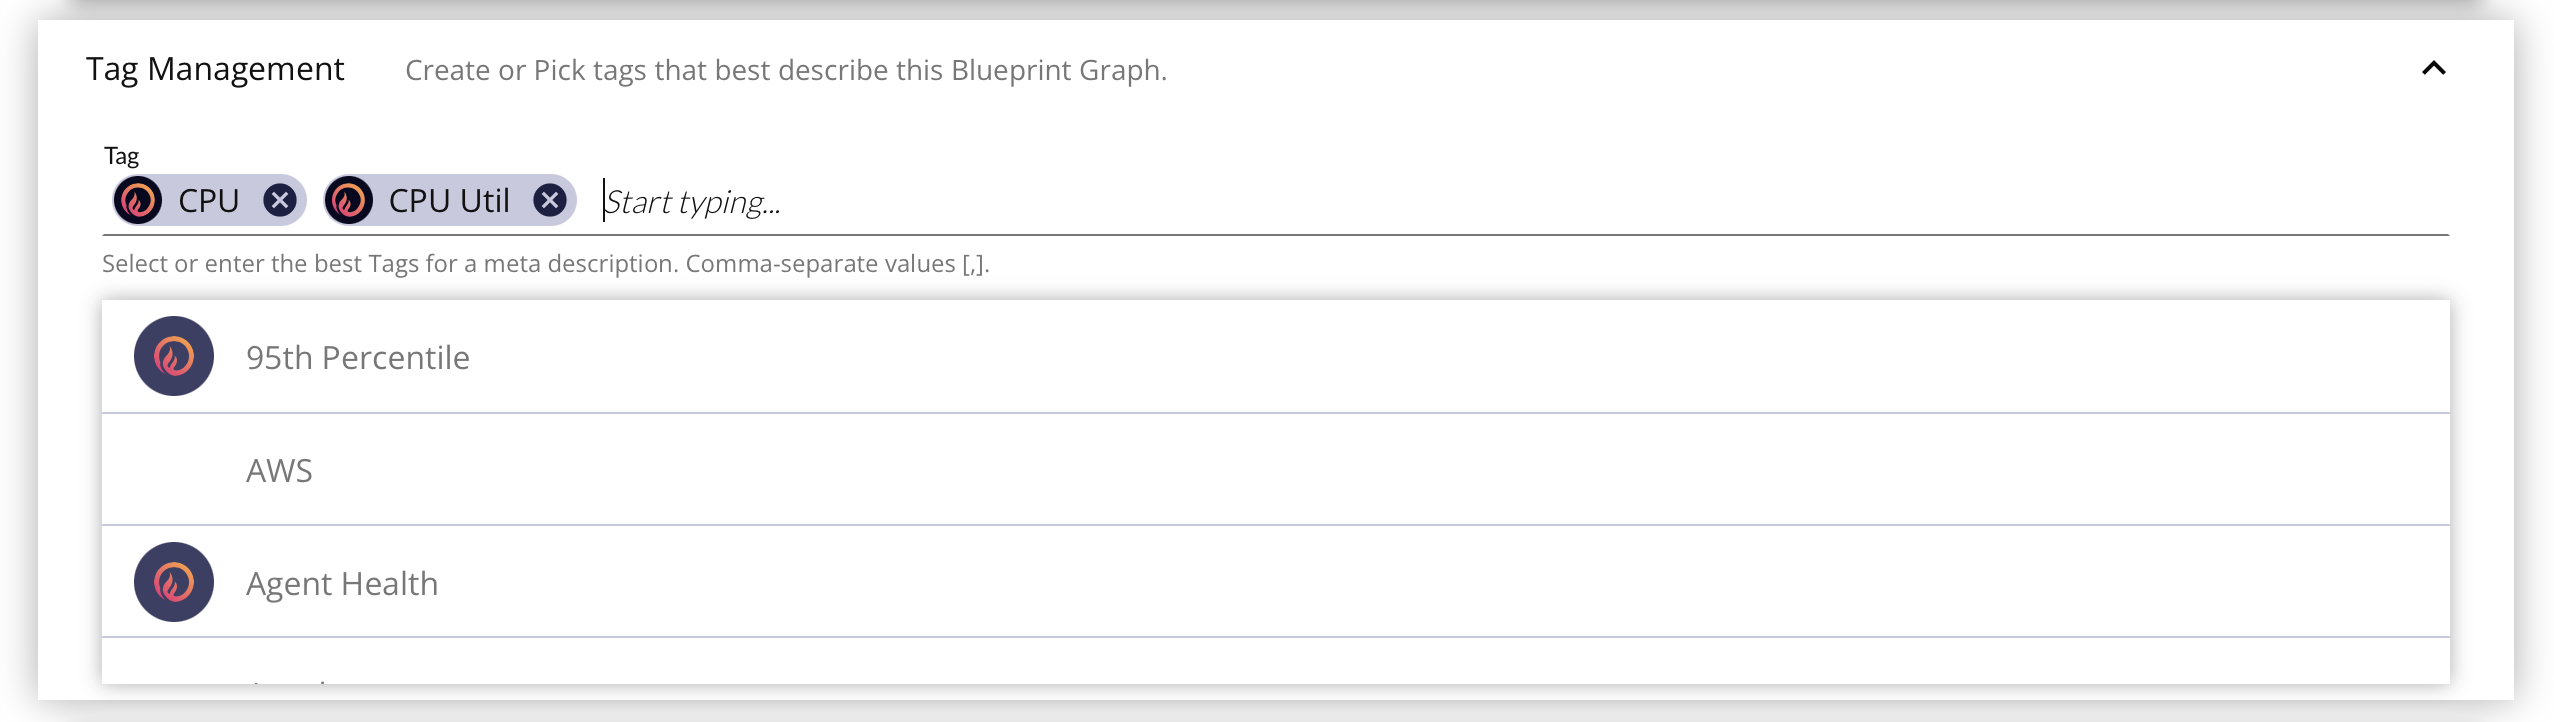
Add Tags to the Blueprint Graph to easily filter to it in the Blueprint Graphs List and to describe similar Blueprint Graphs in a metadata fashion. Enter the Tag name and select it from the list, or use the comma (,) or tab keys to add a new one to the list.
Deleting
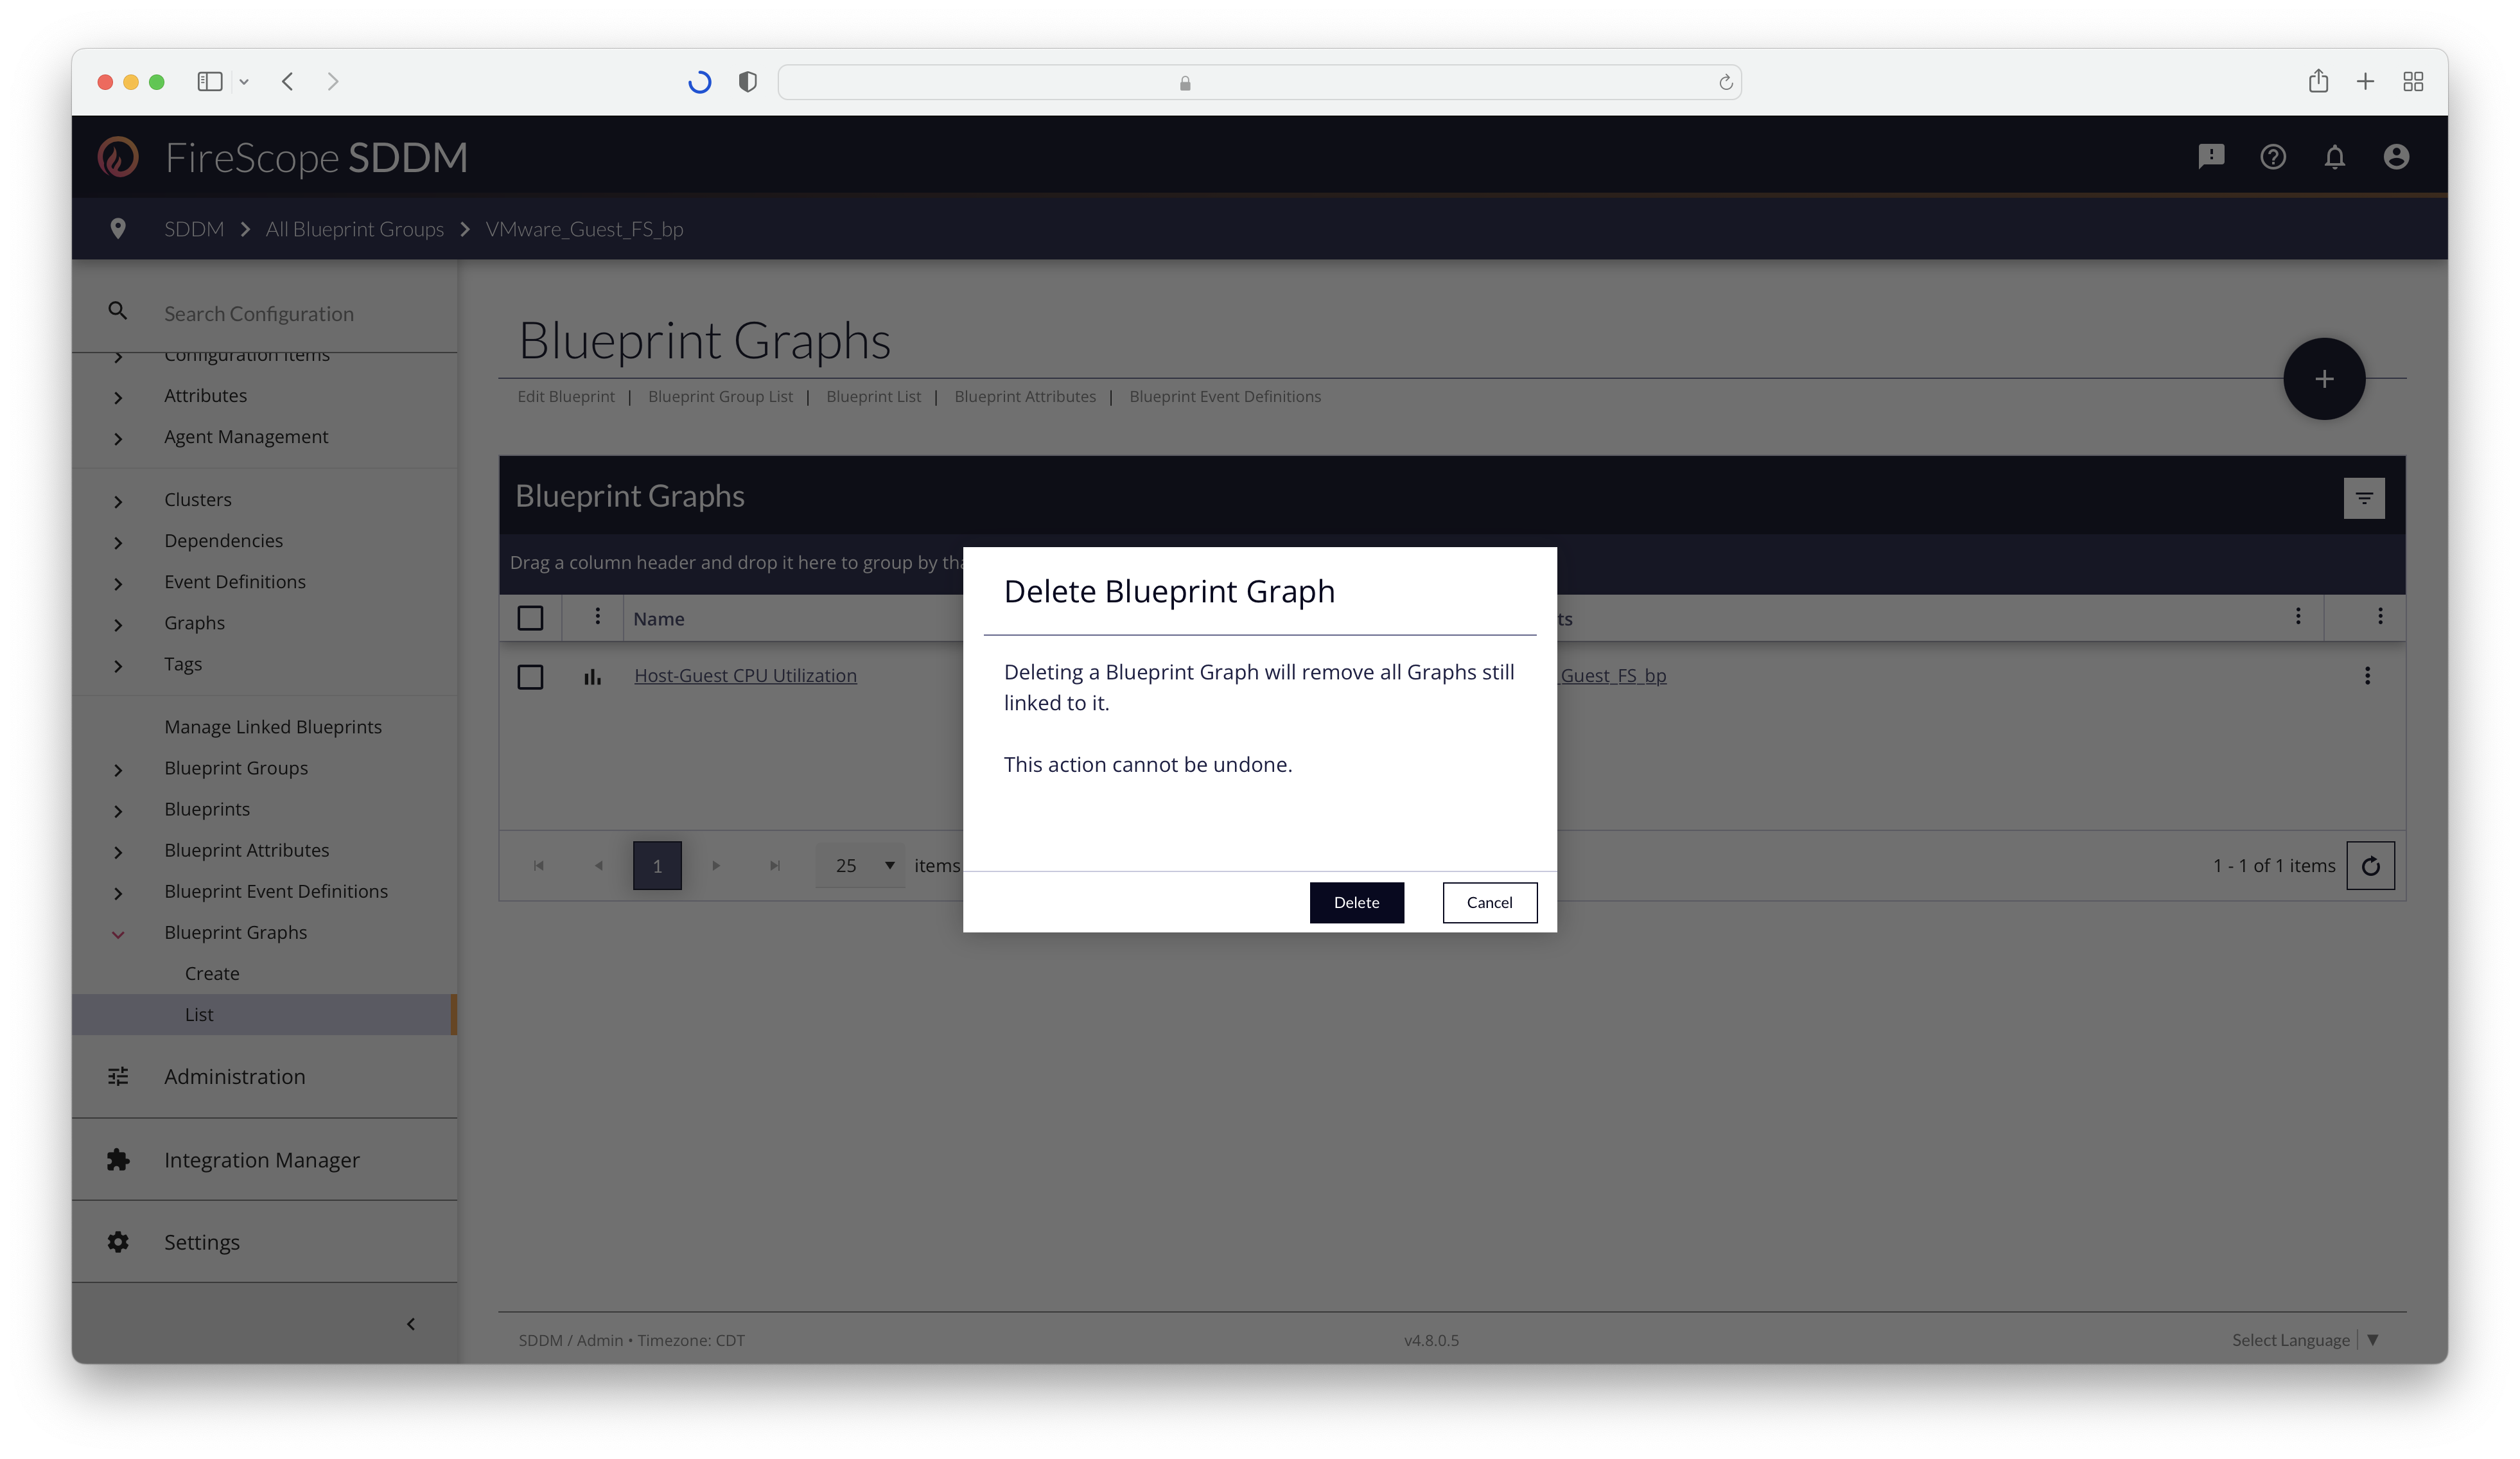
Removing a Blueprint Graph can be done from the List view, the Edit Form of existing Blueprint Graphs, and in the context menu by FireScope Configuration Administrators or higher.
Deleting a Blueprint Graph will remove all Graphs that it created from every Configuration Item linked to the Blueprint.
From the List view, there are 2 methods for deletion: individually, or in bulk.
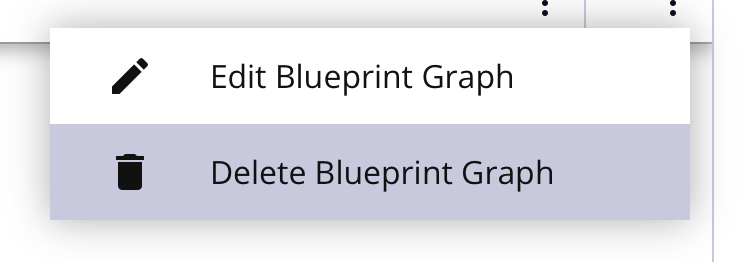 |
To individually delete Blueprint Graphs:
|
 |
To bulk-delete Blueprint Graphs:
|