Report - Software Usage Saving Potential
Overview
This report displays the possible cost saving potential because of unused deployments and unused licenses.
To display the report values a reporting date must be selected. It is also required to select the currency that should be used to display all values.
If you have data stored in different currencies, make sure to provide exchange rates to convert in your desired reporting currency.
The report can be filtered by:
- Company Code
- Software Product
- Organizational Unit
Top 10 Saving Potential
At the top of the report, you can see an overview table and a bar chart for top 10 software products. They display the sum of saved costs per software product from free usage rights and unused local installations for the current year and the next two years.
| Value | Description |
|---|---|
| Usage Rights Free | Value of cost plans from contract items related to licenses with free usage rights. This value is calculated for all free usage rights for the current year and the following two years disregarding months of the current year which have already passed. |
| > 90 days | Value of cost plans from contract items related to licenses entitling installations that have not been used during the last 90 days. This value is calculated for all usage rights from unused installations for the current year and the two following years disregarding months of the current year which have already passed. |
| > 60 days | Value of cost plans from contract items related to licenses entitling installations that have not been used during the last 60 days. This value is calculated for all usage rights from unused installations for the current year and the two following years disregarding months of the current year which have already passed. |
| Total | Sum of all values listed above being the cost saving potential of a software product. |
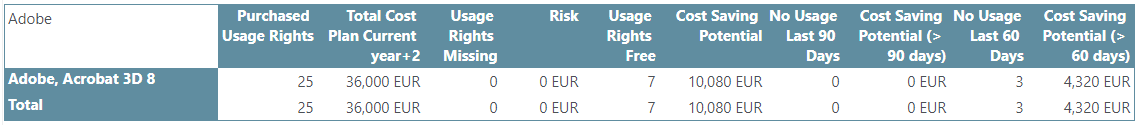
Report per publisher
In the detail area, there are tables which display cost saving potential for all software products grouped by publisher.
| Value | Description |
|---|---|
| Purchased Usage Rights | Number of usage rights that are purchased with licenses. |
| Total Cost Plan Current Year + 2 | Value of cost plans from contract items that are associated with purchased licenses of the respective software product for the current year and the two following years. |
| Usage Rights Missing | Number of usage rights that are missing for entitlement of license requirements. |
| Risk | Value from requisition templates that apply to the missing usage rights for the current year. |
| Usage Rights Free | Number of usage rights that are not used for entitlements. |
| Cost Saving Potential | Value of cost plans from contract items related to licenses with free usage rights. This value is calculated for all free usage rights for the current year and the following two years disregarding months of the current year which have already passed. |
| No Usage Last 90 Days | Number of locally installed applications that were not launched during the last 90 days. |
| Cost Saving Potential (> 90 days) | Value of cost plans from contract items related to licenses entitling installations that have not been used during the last 90 days. This value is calculated for all usage rights from unused installations for the current year and the two following years disregarding months of the current year which have already passed. |
| No Usage Last 60 Days | Number of locally installed applications that were not launched during the last 60 days. |
| Cost Saving Potential (> 60 days) | Value of cost plans from contract items related to licenses entitling installations that have not been used during the last 60 days. This value is calculated for all usage rights from unused installations for the current year and the two following years disregarding months of the current year which have already passed. |
Example
- Purchased licenses have 25 usage rights with cost plan for 3 years being 480 EUR x 25 x 3 = 36,000 EUR.
- 18 usage rights are used to entitle the license requirements while 7 usage rights are free. Cost saving for 7 usage rights will be 480 EUR x 7 x 3 = 10,080 EUR.
- 3 local installations have not been used for the last 60 days. Cost saving for 3 installations will be 480 EUR x 3 x 3 = 4,320 EUR.