Service Desk Dashboard
Overview
Service Desk Dashboard is a powerful tool that provides a comprehensive overview of key metrics and performance indicators related to support and service management.
New Dashboards are available starting from ESMP v.12.1.0 and should be a part of your subscription. If you cannot activate the New Dashboards, please reach out to your Account Manager for assistance.

The New Service Desk Dashboard has extended the standard tracked metrics and introduced a set of new ones. The Service Desk Dashboard is split into different areas described below.
Each metric is displayed in a widget, which can be shown, hidden, moved, resized, added, deleted, or configured. See also, Personalizing Dashboard section of this page.
New widgets can be added or copied from existing ones and then shared with all users in the system or a group of users. See also, Widgets: Standard Widgets Library & Configuration.
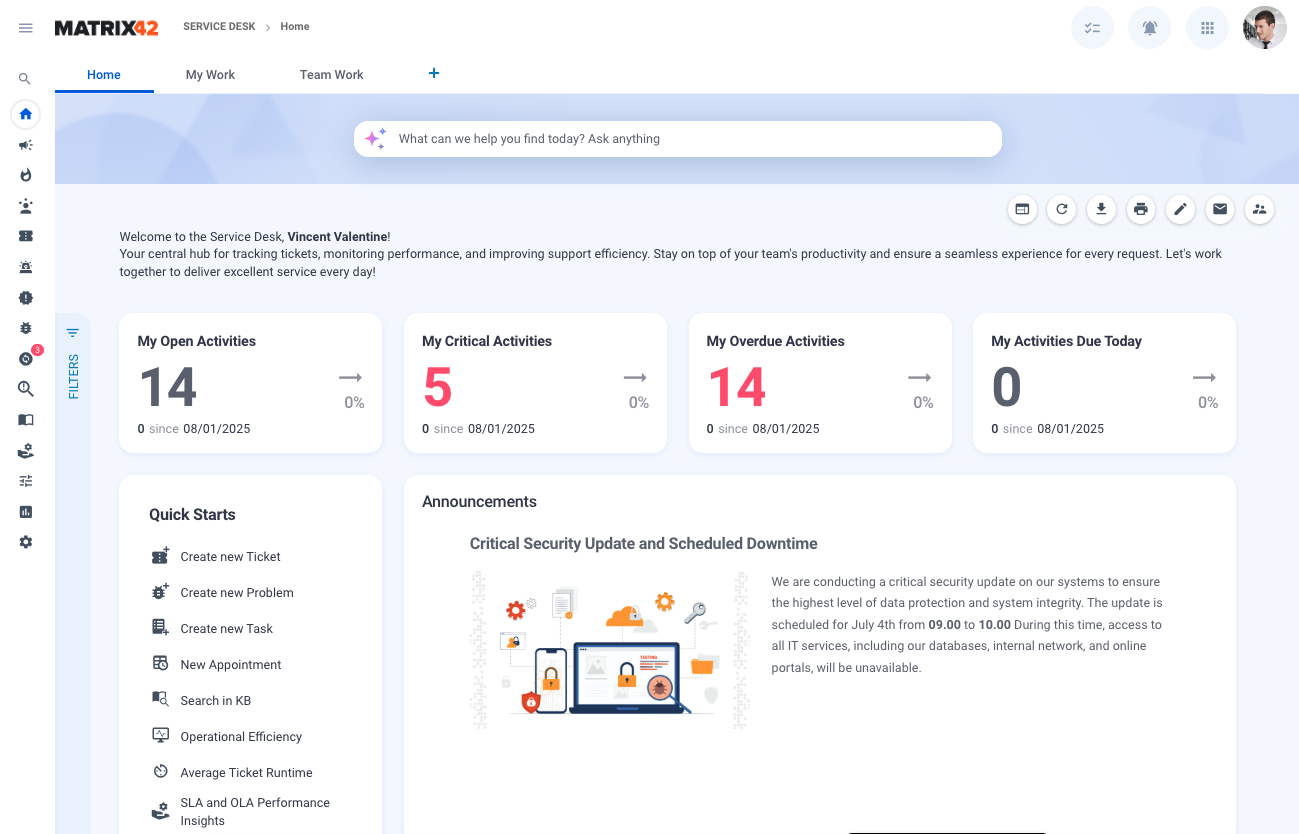
Home
Starting from Enterprise Service Management v. 25.4, the Service Desk dashboard opens with a new area for tracking and managing Major Incidents:

The new area is visually distinct and uses the counters to provide an overview of the number of Major Incidents and my activities that are currently in the following processing stages:
- Active Major Incident Proposals (since v. 25.4): the metric card shows how many Incidents were submitted via the Propose Major Incident action and are pending for approval to be qualified as Major Incidents or should be rejected. See also, Major Incident.
- Open Major Incidents (since v. 25.4): the metric card shows how many opened Major Incidents are in the system.
- My Open Activities (hidden by default since v. 25.4): this metric shows how many activities from the Backlog Items are currently Open or Assigned to Me.
- My Critical Activities (hidden by default since v. 25.4): shows how many activities from the Backlog Items are currently Open or Assigned to Me and have High Priority.
- My Overdue Activities (hidden by default since v. 25.4): shows how many activities from the Backlog Items are currently Open or Assigned to Me and are overdue, based on the activity Solution Point.
- My Activities Due Today (hidden by default since v. 25.4): shows how many activities from the Backlog Items are currently Open or Assigned to Me and are due today, based on the activity Solution Point expected today.
- On hold (hidden by default): my activities that are on status On Hold.
- Critical Unassigned (hidden by default): open activities with the High Priority where Responsible is not yet set.
My activities include incidents, service requests, tasks, and tickets, in which the current user is involved.
Dashboard view with My Activities
Each widget shows the count of activities that fall under the filtered criteria and allows you to drill down into details like Ticket ID, Summary, Priority, Status, User, Responsible, Responsible Role, Created date, Process Until, Queue, Category, Activity type, OLA Reaction Point, OLA Reaction Time Escalated, and OLA Solution Time Escalated. Click on the widget for more details, for instance, My Overdue Activities:

Additionally, the following areas were added for convenience:
- Quick Starts: allows creating a new Ticket, Problem, Task, Appointment, Search in Knowledge Base, and starting from v.12.1.1 view Operational Efficiency report, Average Ticket Runtime report, or SLA and OLA Performance Insights report.
- Announcements: informational messages to communicate changes, updates, or upcoming events in your organization. Shows currently active announcements that are relevant for the current user according to the audience restriction configured in Announcements area of the application.
Additionally, starting with v.12.1.1 the dashboard can be filtered by the following criteria:
- Keywords
- Created date: from/to
- Escalated SLA
- Escalated OLA
- Status
- Priority
- Category
My Work
This area focuses on providing clear visibility of the workload for individual employees. It helps balance different types of activities like Tickets, Incident, Service Request, and Tasks and enables employees to manage their workload efficiently, identify critical tasks, and meet deadlines:

The counters on top of the page provide an overview of the number of the activities assigned to me and their current processing stage:
- My Open Activities: shows the total number of my uncompleted activities. Includes all activities on any status except "Closed" assigned to the employee.
- My Activities Due Today: displays the total number of my activities due on the current day by checking the Solution Point property that is expected today. This metric makes it easier to prioritize and focus on meeting deadlines.
- On Hold: displays the total number of my activities that are currently paused and may need follow-up or are awaiting external input. Includes all activities on status "On Hold"
- My Overdue Activities: displays the total number of my activities that are past their due date. This metric helps employees to define bottlenecks and prioritize these tasks to prevent further delays or escalations.
- Resolved this Month: displays the number of activities the employee has resolved within the current month. This metric takes into account activities on status "Closed".
- My Critical Activities: displays the number of business-critical activities that require immediate attention. This metric takes into account all open activities of the current employee with high priority.
Activity Type is a dynamic filter that allows you to choose which activity types to show on the Dashboard. Choose from the suggested activity types:
- Ticket
- Incident
- Service Request
- Task
By default, My Work Dashboard displays aggregated data including all 4 types of activities. Uncheck the necessary checkboxes to see only the type of activities you are interested in. The metrics and charts are adjusted automatically, for instance, showing only my Incidents might look as follows:

The following data is visualized and represented in charts:
- My Open Activities by Type: breaks down the employee's open activities by type, including Tickets, Incident, Service Request, and Tasks.
- My Open Activities by Status: displays open activities segmented by their current status (e.g., New, Assigned, In Progress, On Hold, Resolved). This helps the employee understand the stage of each task.
- My Open Activities by Priority: categorizes all open activities based on priority levels (e.g., Low, Medium, High).
- My Open Activities by Category: provides a breakdown of open activities based on categories. Similar to the previous My Open Activities by Priority chart, additionally splits the activities by their type (Tickets, Incident, Service Request, and Tasks)
- My Time Reported during last 7 days: displays the total time in minutes logged by the employee on activities over the past week. Additionally visualizes the tracked time by the tracked Activity Type (e.g. Investigation, Recording, Administration, Assignment, Resolution, or Other). See also, Tracking working time.
Click on any widget, chart, or chart data to see the list of activities and their details.
Additionally, starting with v.12.1.1 the dashboard can be filtered by the following criteria:
- Keywords
- Created date: from/to
- Created by
- Escalated SLA
- Escalated OLA
- Status
- Priority
- Category
Team Work
The Team Work page is a dashboard designed to give an overview of the current workload and activity distribution within the Service Desk team. This dashboard helps managers and agents monitor open tasks, identify bottlenecks, and track team performance across various metrics. The charts and metrics provide insights into activity status, priorities, and assignment trends. This Dashboard has metrics similar to My Work Dashboard but for the entire team.
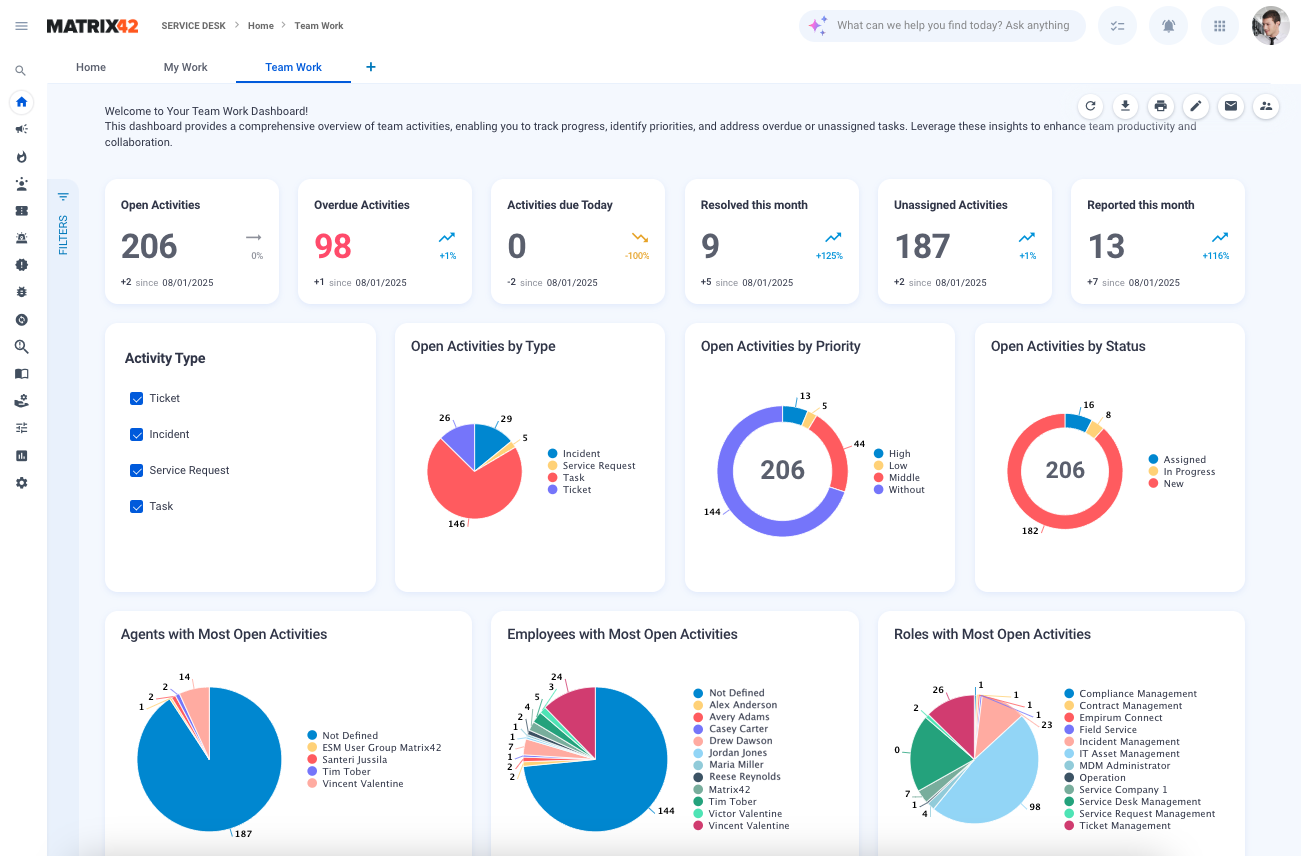
The counters on top of the page provide an overview of the number of the activities (Tickets, Incident, Service Request, and Tasks) and their current processing stage:
- Open Activities: shows the total number of uncompleted activities. Includes all activities on any status except "Closed".
- Overdue Activities: displays the total number of activities that are past their due date. This metric helps employees to define bottlenecks and prioritize these tasks to prevent further delays or escalations.
- Activities Due Today: displays the total number of activities due on the current day by checking the Solution Point property that is expected today. This metric makes it easier to prioritize and focus on meeting deadlines.
- Resolved this Month: shows the number of activities that have been resolved by the team during the current month. This metric takes into account activities on status "Closed".
- Unassigned Activities: shows the total number of uncompleted activities that are currently not assigned to any agent.
- Reported this Month: tracks the number of activities that have been created so far this month.
- Critical Activities (hidden by default): displays the number of business-critical activities that require immediate attention. This metric takes into account all open activities with high priority.
- Activities On Hold (hidden by default): displays the total number of activities that are currently paused and may need follow-up or are awaiting external input. Includes all activities on status "On Hold"
Activity Type is a dynamic filter that allows you to choose which activity types to show on the Dashboard. Choose from the suggested activity types:
- Ticket
- Incident
- Service Request
- Task
By default, the Team Work Dashboard displays aggregated data including all 4 types of activities. Uncheck the necessary checkboxes to see only the type of activities you are interested in. The metrics and charts are adjusted automatically, for instance, showing only Incidents might look as follows:

The following data is visualized and represented in charts:
- Open Activities by Type: a pie chart breaks down the open activities by type, including Tickets, Incident, Service Request, and Tasks.
- Open Activities by Priority: categorizes all open activities based on priority levels (e.g., Low, Medium, High).
- Open Activities by Status: displays open activities segmented by their current status (e.g., New, Assigned, In Progress, On Hold, Resolved).
- Agents with Most Open Activities: the Responsibles who are currently handling the most unresolved activities, helping to track workload distribution among team members.
- Employees with Most Open Activities: highlights the employees who have the highest number of unresolved activities assigned.
- Roles with Most Open Activities: Shows which Responsible Roles (e.g., Incident Manager, Ticket Manager, etc.) have the most open activities assigned to them.
- Reported Activities by Category per month: provides a breakdown of reported activities distributed by month. Additionally highlights the activities by their type.
- Open Activities by Category: provides a breakdown of open activities based on categories. Additionally highlights the activities by their priority.

Click on any widget, chart, or chart data to see the list of activities and their details.
Additionally, starting with v.12.1.1 the dashboard can be filtered by the following criteria:
- Keywords
- Created Date: from/to
- Closed Date: from/to
- Created by
- Responsible Person
- Responsible Role
- Escalated SLA
- Escalated OLA
- Status
- Priority
- Category
Escalation Overview
Starting with v.12.1.1 this data can be found in the Service Desk Reports area. See also, SLA and OLA Performance Insights.
Operational Efficiency
Starting with v.12.1.1 this data can be found in the Service Desk Reports area. See also, Operational Efficiency.
Activating New Dashboards
User Roles
The New Dashboard can be activated from the Service Desk's home page. The action is available for the Service Desk that was already switched to the New Look Design and can be applied by the following user roles:
- Service Desk Management: a default role to manage the Service Desk
- Administration: a default role to administer Matrix42 Enterprise Service Management
Try New Dashboard Action
Open Service Desk → Home → click Try New Dashboard action:
New Dashboards are available starting from ESMP v.12.1.0 and should be a part of your subscription. If you see the following message, please reach out to your Account Manager for assistance:
.png?revision=1)
With the following message, click OK to confirm the action:

The New Dashboard is activated for all users having access to the Service Desk.
Use the  Switch to Classic Dashboard icon on the Service Desk home page to switch the Application back to the old version of Dashboards:

Actions
Different actions can be displayed depending on the user's role and the dashboard configuration:

The following actions are available for New Dashboards:
 Force Reload: by default, the dashboard data is cached for 30 minutes to maintain optimal performance. Use the Force Reload to get changes instantly. The cached time can be managed by the system Adminisrator in the Frontend Settings section of the the Global System Settings.
 Edit: for all users that have access to the Service Desk, allows personalizing the displayed widgets, i.e. choose which ones to show or to hide, change the size of the widget or the order or area where it is displayed. Additionally, the edit mode allows the creation of new widgets and sharing them with other users.
 Back to Original: reverts the applied changes to the default view. Widgets created while personalizing the dashboard or shared widgets are hidden but not removed.
 Publish Layout: this action is available to Administrator and Service Desk Management user roles. Publish Layout publishes the customized layout for all users and makes it a default view. Make sure you have configured and granted access for the new widgets to other users who should see them with Share action, otherwise, it will be published only for the current user.
 Revert Published Layout: reverts the changes that were applied by the Publish Layout action.
-
 Export (starting from v.12.1.1): use this action to export the dashboard data in a file (.PDF, .PNG, or .JPG). Additionally, choose the export options like export with or without footer, page orientation (portrait/landscape), theme, and Color Contrast. For more details, see Managing Dashboards in New Look: Export action.
 -
 Print (starting from v.12.1.1): use this action to export the dashboard data. Additionally, choose the printing options for the footer, page orientation (portrait/landscape), theme, and Color Contrast. For more details, see Managing Dashboards in New Look: Print action.
 -
 Send Report (starting from v.12.1.1): allows sending the dashboard data via e-mail. Specify the recipients, edit the subject, message, choose the signature, and send. For more details, see Managing Dashboards in New Look: Send Report action.
  Share (starting from v.12.1.1): use this action to share access to your dashboard with other users, groups, and/or roles. For more details, see Managing Dashboards in New Look: Share action.
 Subscribe (starting from 12.1.3): with this action, you can subscribe yourself or other users to receive the dashboard data in the specified format and cadence by email. The Subscribe action allows users to share access to dashboards based on their own view of the data. Since data visibility is often personalized, depending on user roles and permissions for widgets, each user may see a different subset of the information. As a result, the same dashboard may appear differently to another user, or it might not be available to them at all. When you subscribe someone else, they receive the dashboard as it appears to you, within the limits of their own access rights. This ensures that shared insights reflect the current user's view while respecting individual data permissions. See also, Subscribe to Dashboards and Reports page.
Personalizing Dashboard
The following steps should help you manage your dashboard layout, making it more efficient and tailored to your needs.
Click Edit action to open the Dashboard Configuration mode. In this mode, you can reorder, resize, manage widgets' visibility, copy and edit existing widgets, create, edit, and remove new widgets, and share them with all, specific groups, roles, or users within your organization.
Done Editing applies changes only for the current user. You can always redo changes and go Back to Original view, or in case you are in the appropriate user role (Service Desk Management role for Service Desk or Service Catalog Management for Service Catalog) you can Publish Layout for your organization.
Reordering
To change the position of widgets:
- Click on the Edit action to enable the Dashboard Configuration mode
- Click on the widget, hold it, and drag it to the new position on the dashboard
- Release it to drop the widget in place
- Click Done Editing to apply changes

Resizing
To adjust the size of a widget:
- Click on the Edit action to enable the Dashboard Configuration mode
- Hover over the top, bottom, right, or left edge of the widget with
 dots icon until you see an arrow icon
 - Click and drag the edge to resize the widget
- Release the drag when the widget is resized appropriately
- Adjust the other widgets' size if necessary
- Click Done Editing to apply changes

Widgets Visibility
To show or hide specific widgets:
- Click on the Edit action to enable the Dashboard Configuration mode
- Look for a list of widgets in the Dashboard Configuration panel
- Use the Hide icon to disable the widget displaying on the Dashboard
- Click the Add icon to show the widget on the Dashboard
- Click Done Editing to apply changes
If the widget is currently displayed on the Dashboard it will be highlighted on the Dashboard when you hover over the widget in the Dashboard Configuration panel.

Copy
To create and edit a copy of the existing widget:
- Click on the Edit action to enable the Dashboard Configuration mode
- Look for a list of widgets in the Dashboard Configuration panel
- Click on More Actions icon with 3 dots next to the widget you need
- Click on the Copy action:

- Adjust the Title, Widget type, and suggested parameters according to the chosen Widget type:

- Click Save in the Dashboard Configuration panel
- Click Done Editing to apply changes
The widget is shown only on your Dashboard. You can share this widget with other employees within your organization with Share action or, if the action is available for your user role, Publish Layout and make it available for all users.
Delete
To delete the widget from the Dashboard:
- Click on the Edit action to enable the Dashboard Configuration mode
- Look for a list of widgets in the Dashboard Configuration panel
- Click on More Actions icon with 3 dots next to the widget you need
- Click on the Remove action:

- Click OK to confirm:

The widget is completely deleted and is no longer shown in the list of widgets of Dashboard Configuration panel. You can remove only the widgets that you have created. This action is not available for other standard or shared widgets but you can still hide or show them on the Dashboard by adjusting widgets visibility. - Click Done Editing to apply changes.
Share
To share the widget that you have created with other users:
- Click on the Edit action to enable the Dashboard Configuration mode
- Look for a list of widgets in the Dashboard Configuration panel
- Click on More Actions icon with 3 dots next to the widget you need
- Click on the Share action:

- Choose from the suggested options:
- Share With All
- Share With Specific Groups or Roles: add user role(s) or specific users on the corresponding tab

By default, if permissions are not set, the widget is not shared with other users and is displayed only on your personalized dashboard. - Click Finish to apply changes.
Share action is available to any user who has access to the Dashboard. The shared widget is not immediately displayed on the Dashboard of the users with whom it's been shared. It is added to the list of other widgets in the Dashboard Configuration panel as hidden. You can hide/add the widget to the dashboard by managing its visibility.
The widget shared with you by another user is marked with the shared icon, as shown in the following example:

Add New Widget
There are several ways to add and configure a new widget to show your data on the Dashboard:
- From the Dashboard Configuration mode
- From the Dataset View via Group by column filtering
For more details on how to add a new Widget, see Managing Dashboards in New Look page and Widgets: Standard Widgets Library & Configuration for properties configuration.