Service Catalog Dashboard
Overview
The Service Catalog Dashboard provides a centralized and dynamic overview of orders and bookings in the system, focusing on tracking performance and order processing efficiency.
New Dashboards are available starting from DWP v.12.1.0 and should be a part of your subscription. If you cannot activate the New Dashboards, please reach out to your Account Manager for assistance.

On this page, you will find a detailed description of the new and improved dashboard and why switching to the New Dashboard would be beneficial.
New Dashboards are available starting from ESMP v.12.1.0 and require an additional license certificate or should be a part of your subscription. If you cannot activate the New Dashboards, please reach out to your Account Manager for assistance.
Key features
-
Up-to-date Data:
- The new dashboard allows retrieving the latest changes with only one click, so users always have the latest information on the status of service requests.
- This helps reduce delays in reacting to requests that require urgent attention.
-
Interactive Visualizations:
- Graphs and charts visually represent how orders flow through the various statuses.
- Clicking on sections allows users to drill down into specific orders, filter by service type, and other criteria.
Key benefits of the New Dashboard
-
Enhanced Visibility into Order Status: the New Dashboard introduces a clear view of orders (open, pending, approved, denied, provisioning filed, and fulfilled), giving agents and managers real-time insight into where orders are in the process. This feature helps teams prioritize tasks, identify bottlenecks, and improve turnaround times.
-
Improved Order Processing Management: by breaking down orders by status, teams can better manage workflows, quickly identify pending approvals, and ensure faster fulfillment of approved requests. This can prevent delays and improve overall service efficiency.
-
Increased Accountability: the denied and pending order views allow teams to track the reasons behind rejected orders or identify orders waiting for further action, providing a clearer picture of where improvements can be made and which departments are responsible for delays.
-
Data-Driven Decision Making: the New Dashboard provides interactive visualizations and detailed drill-down capabilities, allowing for more informed decision-making. Teams can identify trends (e.g., services often getting denied or pending), adjust resource allocation, and optimize service offerings based on data.
-
Streamlined Operations: the enhanced user interface and new features create a more efficient experience. Rather than navigating through multiple screens to track an order's status, all critical information is visible in one dashboard. This streamlines daily operations and reduces the time spent searching for order updates.
-
Better Customer Experience: faster responses and quicker fulfillment times, driven by better tracking and order management, improve customer satisfaction. The dashboard helps the team deliver services more efficiently, with fewer delays or missed approvals.
Switching to the new version would ultimately lead to increased productivity, clearer communication, and better performance tracking, making it a crucial upgrade for any team handling a significant volume of service requests.
Metrics Overview
The dashboard is split into two parts, Home and Consumption.
Home
Home dashboard opens with a new area representing the order distribution by status. The new area is visually distinct and uses the counters for each of the standard order statuses, among them:
- Open Orders: orders that have been submitted but not yet processed. Includes orders in status Pending, Approved, Provisioned, Provisioning Failed, and Acceptance Denied.
- Pending Orders: orders in review or waiting for further action (e.g., approvals). The widget shows the total number of all orders in status Pending.
- Approved Orders: orders that have passed approval stages and are ready to be fulfilled. A dynamic count helps teams focus on unblocking requests that are stuck in this stage. The widget shows the total number of all orders in status Approved.
- Denied Orders: orders that were rejected or denied. The widget shows the total number of all closed orders in status Declined.
- Provisioning Failed: the widget shows the total number of all open orders in the status Provisioning Failed.
- Fulfilled Orders: orders that have been completed and closed. The widget shows the total number of all closed orders in status Fulfilled.
Each order widget shows the count of orders that fall under the filtered criteria and allows you to drill down into details like ID, when the order has been submitted, recipient, requester, cost center, order status, and type. Click on the widget for more details, for instance, Open Orders:

The following areas remained as well:
- Quick Starts: allows creating an Announcement, Service, Service Bundle, Service Group, or Service Set directly from the Dashboard.
- Announcements: informational messages to communicate some changes, updates, or upcoming events in your organization. Shows currently active announcements that are relevant for the current user according to the audience restriction configured in Announcements area of the application.Services by Status: a chart displays the total number of Services and their distribution by Service Status based on the current data from the Service Portfolio.
Additionally, starting with v.12.1.1 the dashboard can be filtered by the following criteria:
- Keywords
- Created date: from/to
- Created by
- Type
- Cost Center
Consumption
The following standard metrics were moved to the Consumption dashboard:

- Services by Status: a donut chart with a total number of Services and grouped by Status
- Top 8: Catalogs: shows the top 8 of the Service Catalogs that are available in the system and the total number of all items (including not only Services, but also Service Bundles, Service Groups, and Service Sets) available in all Catalogs.
- Top 10: Most Consumed Services with ranking of the most frequently requested services.
- Top 10: Consumers With Most Services: displays the top users with the most Bookings in the system.
- Bookings per Month: the total number of Bookings (order item or each service in the order) in the system distributed by months.
- Orders per Month: the total number of Orders in the system distributed by months.
- Employees with the Largest Expenses (starting from v12.1.1): a column chart showing the distribution of expenses by employee

Additionally, starting with v.12.1.1 the dashboard can be filtered by the following criteria:
- Keywords
- Created by
- Service
- User
Activating New Dashboard
User Roles
The New Dashboard can be activated from the Service Catalog's home page. The action is available for the Service Catalog that was already switched to the New Look Design and can be applied by the following user roles:
- Service Catalog Management: a default role to manage services in the Service Catalog
- Administration: a default role to administer Matrix42 Enterprise Service Management
Try New Dashboard Action
Open Service Catalog → Home → click Try New Dashboard action:

Click OK to confirm the action:

The New Dashboard is activated for all users having access to the Service Catalog.
Use the  Switch to Classic Dashboard icon on the Service Desk home page to switch the Application back to the old version of Dashboards:

Actions
Different actions can be displayed depending on the user's role and the dashboard configuration:

The following actions are available for New Dashboards:
 Force Reload: by default, the dashboard data is cached for 30 minutes to maintain optimal performance. Use the Force Reload to get changes instantly. The cached time can be managed by the system Adminisrator in the Frontend Settings section of the the Global System Settings.
 Edit: for all users that have access to the Service Catalog, allows personalizing the displayed widgets, i.e. choose which ones to show or to hide, change the size of the widget or the order or area where it is displayed. Additionally, the edit mode allows the creation of new widgets and sharing them with other users.
 Back to Original: reverts the applied changes to the default view. Widgets created while personalizing the dashboard or shared widgets are hidden but not removed.
 Publish Layout: this action is available to Administrator and Service Catalog Management user roles. Publish Layout publishes the customized layout for all users and makes it a default view.
 Revert Published Layout: reverts the changes that were applied by the Publish Layout action.
-
 Export (starting from v.12.1.1): use this action to export the dashboard data in a file (.PDF, .PNG, or .JPG). Additionally, choose the export options like export with or without footer, page orientation (portrait/landscape), theme, and Color Contrast.
 -
 Print (starting from v.12.1.1): use this action to export the dashboard data. Additionally, choose the printing options for the footer, page orientation (portrait/landscape), theme, and Color Contrast.
 -
 Send Report (starting from v.12.1.1): allows sending the dashboard data via e-mail. Specify the recipients, edit the subject, message, choose the signature, and send.
  Share (starting from v.12.1.1): use this action to share access to your dashboard with other users, groups, and/or roles.
Export
Starting from v.12.1.1, use this action to download the dashboard data in a file. Click on the action and configure the following export options:
- Choose file type:
- .PDF (default)
- .PNG: high-quality image with no loss in detail or clarity, has a larger file size compared to JPG file format
- .JPG: good quality image that has a smaller file size compared to .PNG file format
- Include footer and header:
- Yes (default): the header of the downloaded file includes the logo and the page name, and the footer contains the name of the user and the current date. The content of the footer and header depends on the selected in the Global System Settings template and can be redefined by the Administrator. See also, Print Header/Footer property in the General section of the Global System Settings.
- No: the described above content of the header and footer is not present in the file, only the content of the dashboard is exported.
- Page orientation:
- Portrait (default): the page is oriented vertically, and the height is longer than the width.
- Landscape: the page is oriented horizontally, and the width is longer than the height.
- Theme: choose from the suggested themes (light, dark, or other if more themes were activated for your system). The current theme selected in your profile is selected by default.
- Enhance Color Contrast:
- Yes: the file content is exported in Enhanced Color Contrast mode.
- No (default): the content has the colors from the selected in the export theme.
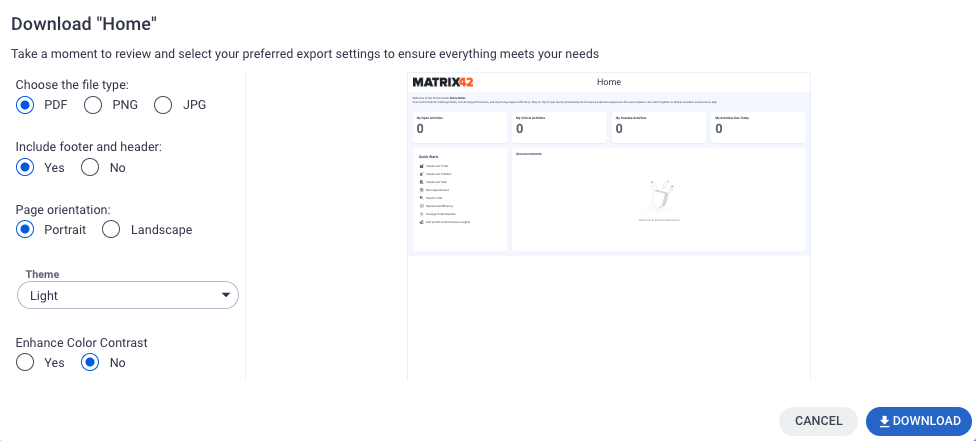
Click Download to save the file.
Starting from v.12.1.1, use this action to print the dashboard data. Click on the action and configure the following options:
- Include footer and header:
- Yes (default): the header of the downloaded file includes the logo and the page name, and the footer contains the name of the user and the current date. The content of the footer and header depends on the selected in the Global System Settings template and can be redefined by the Administrator. See also, Print Header/Footer property in the General section of the Global System Settings.
- No: the described above content of the header and footer is not present on the page, only the content of the dashboard is exported.
- Page orientation:
- Portrait (default): the page is oriented vertically, and the height is longer than the width.
- Landscape: the page is oriented horizontally, and the width is longer than the height.
- Theme: choose from the suggested themes (light, dark, or other if more themes were activated for your system). The current theme selected in your profile is selected by default.
Use the Light theme to lower the ink consumption of your printer.
- Enhance Color Contrast:
- Yes: the file content is exported in Enhanced Color Contrast mode.
- No (default): the content has the colors from the selected in the export theme.

Click Print to proceed with printer selection depending on your device configuration.
Send Report
Starting from v.12.1.1, use this action to send the dashboard data to the specified recipients. Click on the action and configure the following options:
- Choose file type:
- .PDF (default)
- .PNG: high-quality image with no loss in detail or clarity, has a larger file size compared to JPG file format
- .JPG: good quality image that has a smaller file size compared to .PNG file format
- Include footer and header:
- Yes (default): the header of the sent file includes the logo and the page name, and the footer contains the name of the user and the current date. The content of the footer and header depends on the selected in the Global System Settings template and can be redefined by the Administrator. See also, Print Header/Footer property in the General section of the Global System Settings.
- No: the described above content of the header and footer is not present on the page, only the content of the dashboard is exported.
- Page orientation:
- Portrait (default): the page is oriented vertically, and the height is longer than the width.
- Landscape: the page is oriented horizontally, and the width is longer than the height.
- Theme: choose from the suggested themes (light, dark, or other if more themes were activated for your system). The current theme selected in your profile is selected by default.
- Enhance Color Contrast:
- Yes: the file content is sent in Enhanced Color Contrast mode.
- No (default): the content has the colors from the theme selected on this page.

Click Send Report to proceed with the following configuration:
- To: in the suggested field, specify the recipients of your e-mail. You can use suggestions from All Users in the system, specific Role(s), or just manually add the e-mail address(es) of any recipient(s).
- Message: edit the Subject of the e-mail, the Message, and select the Signature from the suggested list.

Click Finish when ready.
Share
To share the widget that you have created with other users:
- Click on the Edit action to enable the Dashboard Configuration mode
- Look for a list of widgets in the Dashboard Configuration panel
- Click on More Actions icon with 3 dots next to the widget you need
- Click on the Share action:

- Choose from the suggested options:
- Share With All
- Share With Specific Groups or Roles: add user role(s) or specific users on the corresponding tab

By default, if permissions are not set, the widget is not shared with other users and is displayed only on your personalized dashboard. - Click Finish to apply changes.
Share action is available to any user who has access to the Dashboard. The shared widget is not immediately displayed on the Dashboard of the users with whom it's been shared. It is added to the list of other widgets in the Dashboard Configuration panel as hidden. You can hide/add the widget to the dashboard by managing its visibility.
The widget shared with you by another user is marked with the shared icon, as shown in the following example:

Personalizing Dashboard
The following steps should help you manage your dashboard layout, making it more efficient and tailored to your needs.
Click Edit action to open the Dashboard Configuration mode. In this mode, you can reorder, resize, manage widgets' visibility, copy and edit existing widgets, create, edit, and remove new widgets, and share them with all, specific groups, roles, or users within your organization.
Done Editing applies changes only for the current user. You can always redo changes and go Back to Original view, or in case you are in the appropriate user role you can Publish Layout for your organization.
Reordering
To change the position of widgets:
- Click on the Edit icon to enable the Dashboard Configuration mode
- Click on the widget, hold it, and drag it to the new position on the dashboard
- Release it to drop the widget in place
- Click Done Editing to apply changes

Resizing
To adjust the size of a widget:
- Click on the Edit icon to enable the Dashboard Configuration mode
- Hover over the top, bottom, right, or left edge of the widget with
 dots icon until you see an arrow icon
 - Click and drag the edge to resize the widget
- Release the drag when the widget is resized appropriately
- Adjust the other widgets' size if necessary
- Click Done Editing to apply changes

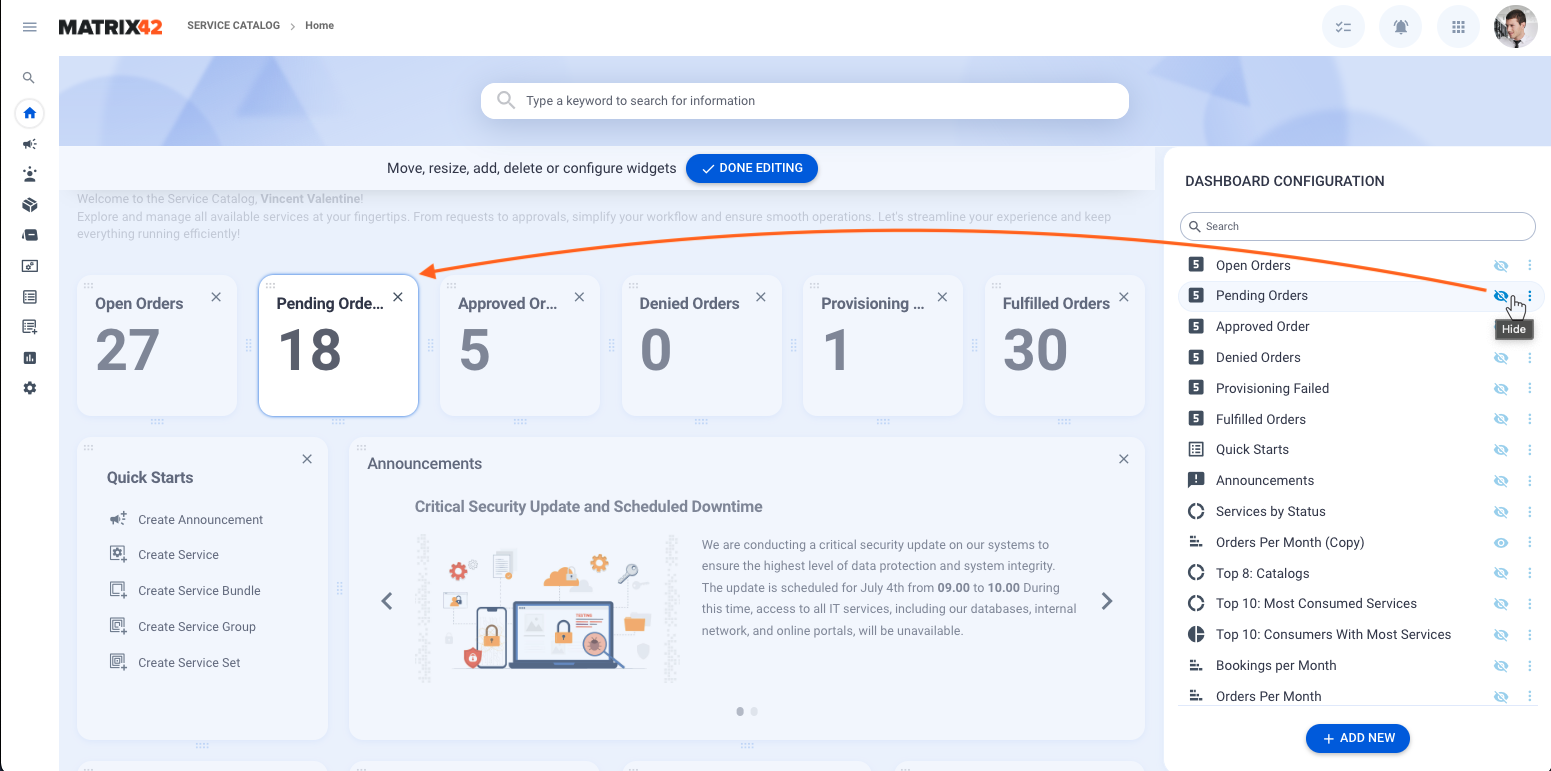
Widgets Visibility
To show or hide specific widgets:
- Click on the Edit icon to enable the Dashboard Configuration mode
- Look for a list of widgets in the Dashboard Configuration panel
- Use the Hide icon to disable the widget displaying on the Dashboard
- Click the Add icon to show the widget on the Dashboard
- Click Done Editing to apply changes
If the widget is currently displayed on the Dashboard it will be highlighted on the Dashboard when you hover over the widget in the Dashboard Configuration panel.
Copy
To create and edit a copy of the existing widget:
- Click on the Edit action to enable the Dashboard Configuration mode
- Look for a list of widgets in the Dashboard Configuration panel
- Click on More Actions icon with 3 dots next to the widget you need
- Click on the Copy action:

- Adjust the Title, Widget type, and suggested parameters according to the chosen Widget type:

- Click Save in the Dashboard Configuration panel
- Click Done Editing to apply changes
The widget is shown only on your Dashboard. You can share this widget with other employees within your organization with Share action or, if the action is available for your user role, Publish Layout and make it available for all users.
Delete
To delete the widget from the Dashboard:
- Click on the Edit action to enable the Dashboard Configuration mode
- Look for a list of widgets in the Dashboard Configuration panel
- Click on More Actions icon with 3 dots next to the widget you need
- Click on the Remove action:

- Click OK to confirm:

The widget is completely deleted and is no longer shown in the list of widgets of Dashboard Configuration panel. You can remove only the widgets that you have created. This action is not available for other standard or shared widgets but you can still hide or show them on the Dashboard by adjusting widgets visibility. - Click Done Editing to apply changes.
Share
To share the widget that you have created with other users:
- Click on the Edit action to enable the Dashboard Configuration mode
- Look for a list of widgets in the Dashboard Configuration panel
- Click on More Actions icon with 3 dots next to the widget you need
- Click on the Share action:

- Choose from the suggested options:
- Share With All
- Share With Specific Groups or Roles: add user role(s) or specific users on the corresponding tab
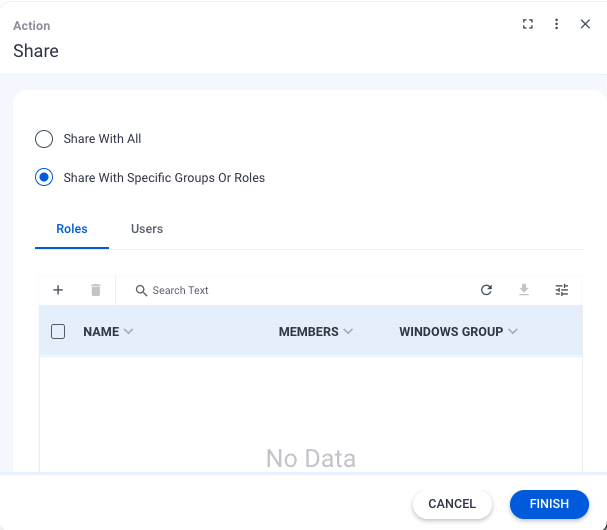
By default, if permissions are not set, the widget is not shared with other users and is displayed only on your personalized dashboard.
- Click Finish to apply changes.
Share action is available to any user who has access to the Dashboard. The shared widget is not immediately displayed on the Dashboard of the users with whom it's been shared. It is added to the list of other widgets in the Dashboard Configuration panel as hidden. You can hide/add the widget to the dashboard by managing its visibility.
Add New Widget
There are several ways to add and configure a new widget to show your data on the Dashboard:
- From the Dashboard Configuration mode
- From the Dataset View via Group by column filtering
For more details on how to add a new Widget, see Managing Dashboards in New Look page and Widgets: Standard Widgets Library & Configuration for properties configuration.