Azure Agent Dependency Collection
Goal
Virtual machines inside of an Azure environment pose a challenge in providing traffic or ‘flow’ information. While Azure does provide NSG flows, the traffic provided is ingress and egress of the NSG only and therefore does not provide internal VM relationship information necessary for application mapping. Even if the internal details were provided, this comes at a price to the end user that can be quite costly. FireScope does provide a solution to this problem using our agent to query the VM for netstat information that is converted into traffic flow data and provided to the Edge Device. Once the Edge receives the traffic data, it is sent to the account just as all other traffic from other sources (netflow, sflow, ipfix, or packet data) for mapping and other traffic forensics.
Setup requirements
- Download and deploy the FireScope Agent which is available for Windows, Linux, and many other Unix variations. See Agent Deployment instructions.
- This agent contains the script used to request the traffic information from the OS.
- Upon request by the edge device, per the applied Blueprint, this traffic information will be sent to the edge device via HTTPS for processing.
- Ensure the additional port 8048 is open in the OS firewall and Network firewall from the agent to the Edge Device.
- Import the Agent_Traffic_Collection_BP.xml blueprint into the FireScope account. See Blueprint Import and Creation instructions.
- Perform one of several types of device discovery provided by FireScope and/or manually create server Cis which already have the agent deployed
Configuration Steps
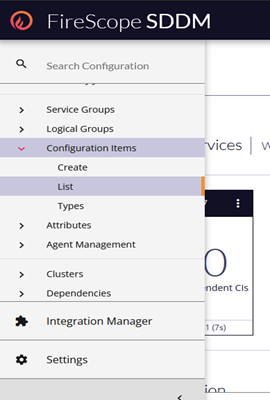
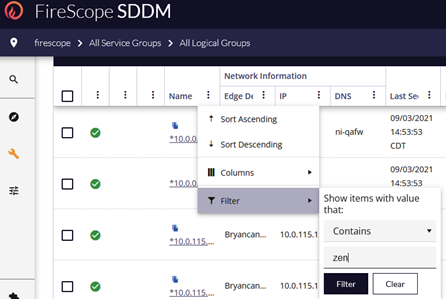
- First, locate the CI which has met the requirements above in the Configuration > Configuration Items > List.
- Filter the List to find the desired Configuration Item.
- Click the name of the CI to open the record for editing.
- Scroll down and expand the Blueprints Panel
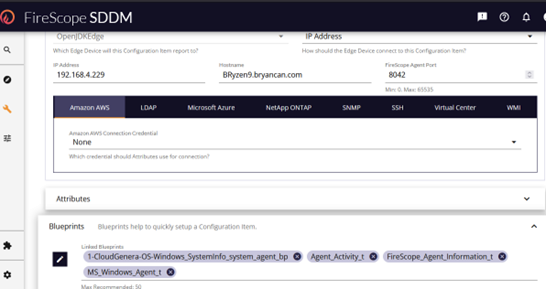
- Left click the pencil/edit icon to open the Blueprint list.
- Use the column filter to locate the imported traffic blueprint.
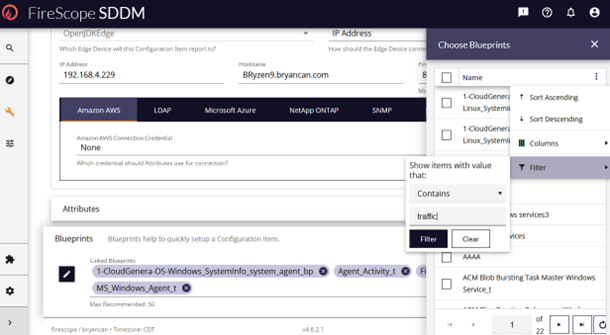
- Check the box of the Agent_Traffic_Collection_BP which will cause that BP item to appear in the Blueprints list.
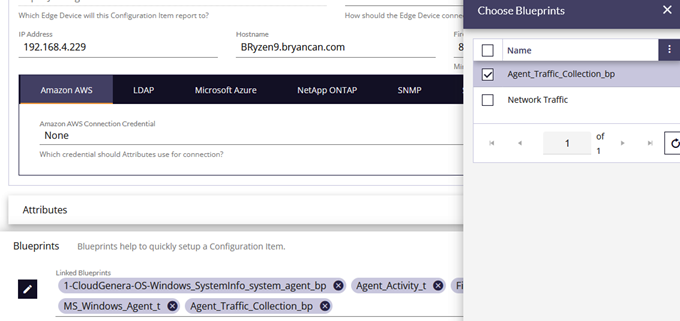
- Close the “Choose Blueprints” window.
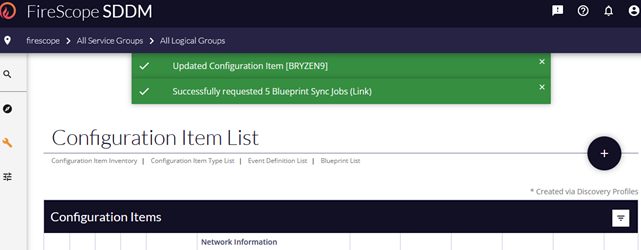
- Scroll down to the bottom of the form and select the Save button.
- This will result in a confirmation message and redirect back to the Configuration Items List.
- Now view the CI Attributes to ensure the BP has deployed and working properly. Note: The BP deployment process can take a minute or two to deploy and begin sending requests to the agent CI.
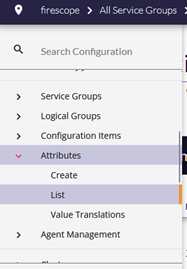
- In the left menu, Under Configuration expand Attributes and select List.
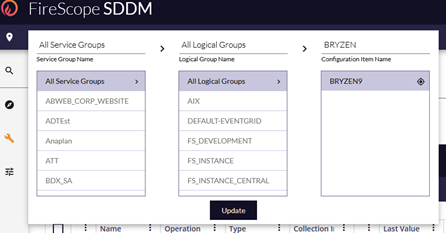
- If the desired CI is not already selected in the bread crumb navigation, click to search for the correct CI.
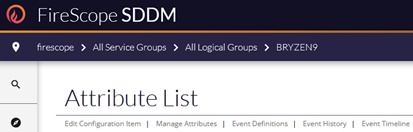
- Once the attributes for the proper CI are listed locate the ‘Server Traffic’ attribute and after a minute or two, you’ll see results in the last value.
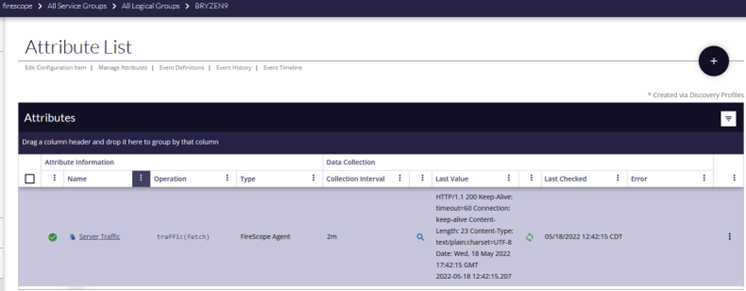
This result is simply confirming that the request was made, and that the agent successfully sent traffic data to the edge device.
- A couple things to check:
- The HTTP/1.1 200 is the success code, any other number but 200 will need to be examined.
- Also, the timestamp of the event is listed for reference.
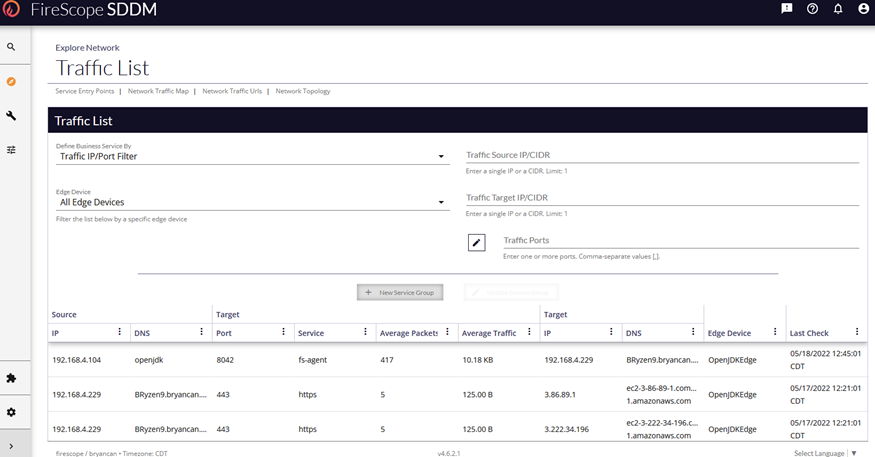
- Now check the Network traffic list to see the traffic.
The traffic process in the edge can take 15 minutes or more depending on global settings for traffic collection.
- In the left menu expand Explore, then Network, and select Traffic List.
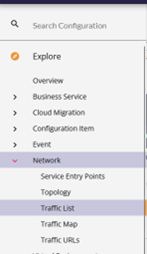
- The resulting page is where you will eventually find the traffic from all methods of traffic collection being employed including this agent method.