Data Collection Methods
Overview
In order to ensure you are receiving the richest set of system events and data possible, FireScope offers a variety of data collection types to choose from. You can select data collection methods on a host-by-host basis. For instance, data on network equipment can be collected through SNMP, while servers communicate through rich agents. Not all data collection methods offer the same range of data types, and each has its own set of limitations and prerequisites. The table below will guide you through the available collection methods to help you strategize the best deployment for your unique environment.
Colection Methods
| Method | Requirements | Additional Information |
| Agent Remote | A type of FireScope agent data access where agent sends data back to the Edge device periodically vs. utilizing the poller service from the Edge device. | |
| Attribute Incoming | This is also referred to as a Dynamic Data Attribute | |
| Attribute JSON Incoming | This is also referred to as a Dynamic Data Attribute | |
| Calculated Attribute | You can use this attribute to combine other attributes’ values. Configuring a Calculated Attribute | |
| Cisco UCS | Requires CI to have a link to Cisco UCS Credential | Collect metrics using Cisco UCS API |
| Derived Check | Internal metrics such as number of attributes or event definitions. | |
| FireScope Agent | Agent must be installed on device. Currently available for most operating systems, including Windows, Linux, Unix, BSD. | This method offers the largest scope of information collection. It includes log data from any log file on the host machine as well as system performance data and direct database connectivity. See Installing an Agent. |
| Grouped Check | Calculated values within a logical group of CI’s for a given an attribute’s operation Grouped Check Attribute | |
| Infoblox Attributes | Requires CI to have a link an Infoblox API credential | Collect network information defined in Infoblox Manager (ex. network ranges, etc) |
| LDAP Check | Requires CI to have a link to LDAP credential | Collect metrics using LDAP queries |
| NetApp Check | Requires CI to have a link to NetApp ONTAP credential | Collect metrics directly from a NetApp Filer using ONTAP API |
| NetApp DFM Check | Requires CI to have a link to NetApp DFM credential | Collect filer volume metrics from a NetApp DFM |
| Percentile Attribute | Value of other attributes at specified percentile for a specific time window in days. (information on percentile calculations) | |
| SNMP Trap | Collects messages forwarded to FireScope from SNMP devices Configuring an SNMP Trap Attribute | |
| SNMP v1 | Device must be SNMPv1 compatible or have an SNMP agent installed. This includes most networked assets. | The SNMPv1 SMI specifies the use of a number of SMI-specific data types, which are divided into two categories:Simple data typesApplication-wide data types |
| SNMP v2 | Device must be SNMPv2 compatible or have an SNMP agent installed. | The SNMPv2 SMI is described in RFC 2578. It makes certain additions and enhancements to the SNMPv1 SMI-specific data types, such as including bit strings, network addresses, and counters. Bit strings are defined only in SNMPv2 and comprise zero or more named bits that specify a value. Network addresses represent an address from a particular protocol family. SNMPv1 supports only 32-bit IP addresses, but SNMPv2 can support other types of addresses as well. Counters are non-negative integers that increase until they reach a maximum value and then return to zero. In SNMPv1, a 32-bit counter size is specified. In SNMPv2, 32-bit and 64-bit counters are defined.Additionally, SNMPv2 also specifies information modules, which specify a group of related definitions. Three types of SMI information modules exist: MIB modules, compliance statements, and capability statements.MIB modules contain definitions of interrelated managed objects.Compliance statements provide a systematic way to describe a group of managed objects that must be implemented for conformance to a standard.Capability statements are used to indicate the precise level of support that an agent claims with respect to a MIB group. An NMS can adjust its behavior toward agents according to the capabilities statements associated with each agent. |
| SNMP v3 | Device must be SNMPv3 compatible or have an SNMP agent installed. | Essentially offers the same information as SNMPv2, with the addition of 3 important security features:Message integrity to ensure that a packet has not been tampered with in transit.Authentication to verify that the message is from a valid source.Encryption of packets to prevent snooping by an unauthorized source. |
| Syslog Message | Device must have Syslog agent, which is common on most non-Microsoft operating systems. | Limited to data stored in log files, which does not include most system performance metrics. However, on most platforms the administrator can define what information to log. |
| TCP Check | Collects information by connecting via IP and Port. | |
| Simple Check | No requirements. Performed directly through the FireScope SPM appliance. | A simple check is ping testing to verify a host is reachable. Available/Unavailable and response times are the only types of information this method can collect. |
| VM Guest | Requires CI to have a link to VM credential | Collects metrics regarding VM Guests |
| VM Host | Requires CI to have a link to VM credential | Collects metrics regarding VM Hosts |
| VM Virtual Center | Requires CI to have a link to VM credential | Collects metrics regarding VM Virtual centers |
| Web Monitoring(User Experience Checks) | No requirements. Performed directly through the FireScope SPM installation. | Web monitoring simulates a user experience on a web-based application and measures response and download times.See User Experience Checks. |
Attribute
.An Attribute is a specific metric or log you wish to collect data for–such as CPU load average or response time–and is associated with a Configuration Item (CI). An Attribute can refer to a metric obtained via any of FireScope SPM’ data collection methods. Attributes can be configured as the following value types:
| Value | Type | Description |
| 0 | Float | Double e.g. 3.14 |
| 1 | String | Character (max size 1024) e.g. “Hello world” |
| 2 | Log | Actual lines from a log attribute / Windows Event log attribute (Max size 65535) |
| 3 | Long | Integer e.g. 2147483647 |
| 4 | Text | Very large “String” equivalent of a CLOB (Max size 65535) |
| 9 | JSON | (Max size 4096)e.g. {“first_name”:”Bryan”,”company_name”:”FireScope”} |
The easiest way to add Attributes for a CI is to associate the CI with a Blueprint. Blueprints are pre-configured CIs of a specific type–such as Windows Server or Cisco 2600–and include a list of commonly used Attributes, Event Definitions, and Visual Controls. You can associate more than one Blueprint with a CI.
Create an Attribute:
- Log in to FireScope SPM.
- Click on Configuration > CIs > Attributes. The Attributes page displays the Attributes for the selected Configuration Item (in the top left corner).
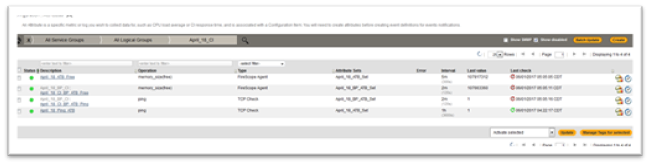
- In Navigate or Search for a description, select the CI you want to create the Attribute for.
- Click on the Create button (in the top right corner). The Create Attribute page will be displayed.
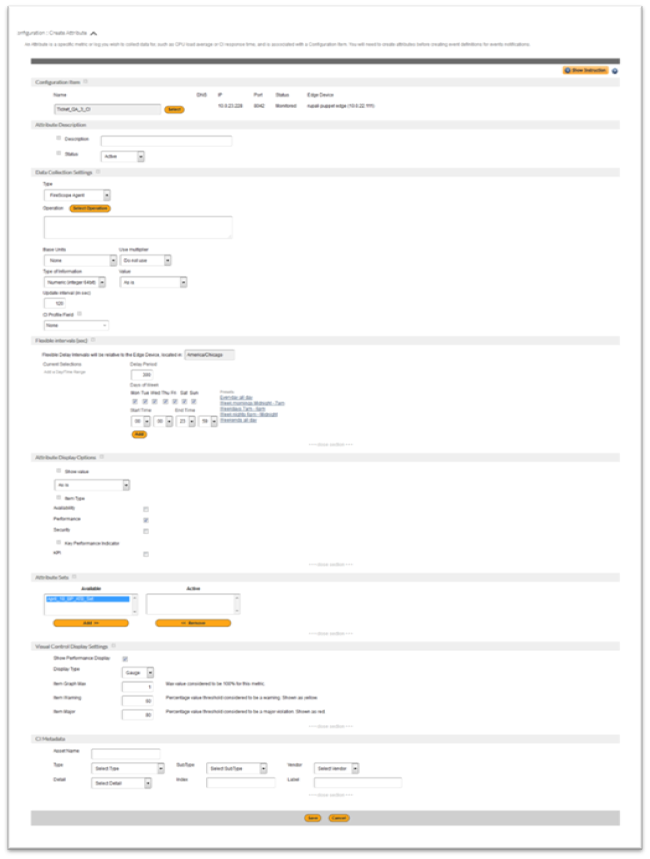
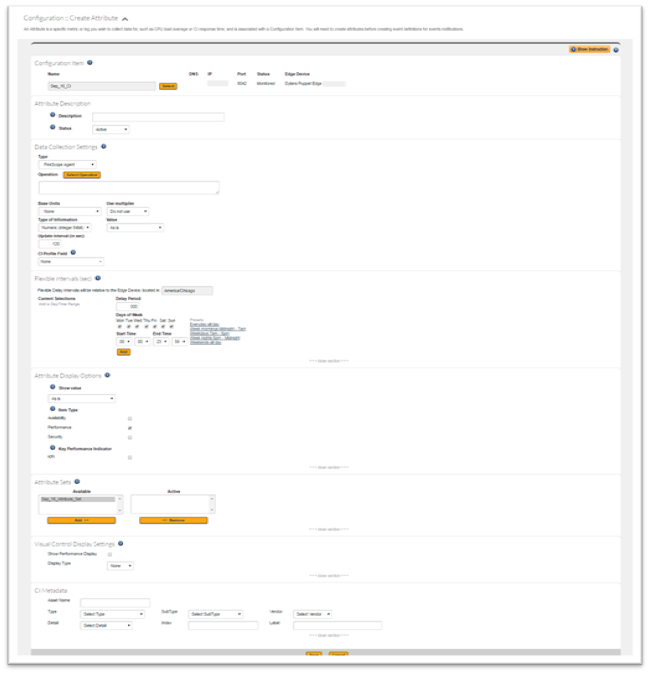
- Configuration Item : Attributes are associated with a specific CI. Select a Configuration Item that you want this attribute to be associated with.
- Description: Enter a descriptive name for this item.
- Status: This field indicates whether FireScope is actively collecting data for this attribute. Not Supported indicates that there is a problem with the data being collected.
- Data Collection Settings: This section defines how FireScope should gather values for this attribute, either through the FireScope Agent, SNMP or other means. If you are using FireScope agent please make sure the selected operation is defined in the FireScope Agent’s configuration. For SNMP, you must enter the credentials required to access the SNMP connection (port 161) of the device. The Update interval tells FireScope how often to check values. The Value field allows you to either collect the raw value or its rate of change over time.
- Type: This determines how FireScope SPM should gather values for the Attribute. Depending on what you select, additional form fields may appear.
- Operation: Select the operation for gathering data. For e.g. If you are using FireScope agent please make sure the selected operation is defined in the FireScope Agent’s configuration. For SNMP, you must enter the credentials required to access the SNMP connection (port 161) of the device.
- Base Units: Select base unit type appended to the end of all values for this Attribute whenever they are displayed. For example, (%) Percent for processor utilization, (B) Bytes for file system size, and (Bps) Bytes Per Second for network performance.
- Use multiplier: In case you want to convert the value mathematically before storing, such as converting bits to bytes, select Custom multiplier. Type the number to multiply in the Custom multiplier field.
- Type of Information: Format of values that will be returned by this Attribute.
- Value: Option to find how much a value has changed since the last time this Attribute was queried. In this case, select Delta (speed per second) or Delta (simple change) to have FireScope SPM only record these values. Select As is to record the actual value.
- Update interval (in sec): This field determines how often, in seconds, FireScope SPM should retrieve or listen for new data.E.g. Enter 60 to check every minute, 3600 for once an hour, or 86400 for once a day.
- CI Profile Field: Name of a field (default or custom) to update for this CI’s profile section. This feature is useful for selecting certain attributes as asset or CMDB information for a particular CI.
- Flexible intervals (sec): Use this setting to vary how often you want this data sampled.
- Attribute Display Options: Other options that will be affect the displaying method the data.
- Show value: Is the raw value of this attribute meaningful? If not, FireScope can display an alternative value using this setting.For example, if the possible results of this attribute are either 1 or 0, you can use value translations to display ‘Good’ for 1 and ‘Bad’ for 0.
- Item Type: Classify whether or not this attribute impacts the Security, Availability, Performance or Business Impact of the CI this attribute is associated with. Choose all that apply.
- Availability
- Performance
- Security
- Key Performance Indicator: Setting this property will enable some summary views of CIs to display the attributes labeled as KPI.
- Attribute Sets: Attribute Sets are related groups of attributes, such as MySQL performance attributes or Active Directory lookup metrics.
- Visual Control Display Setting: Use this section to automatically create graphs, gauges and meters based on the value of this attribute.
- Show Performance Display:
- Display Type:
- CI Metadata:
Options for using metadata.- Asset Name
- Type
- Detail
- SubType
- Index
- Vendor
- Label
- Tags: Tags are additional identification applied to the main configuration elements: Service Groups, Logical Groups, Configuration Items, Attributes, Event Definitions, Aggregate Event Definitions, Policies, and Visual Controls.Tags are used for search, reports and some specialized displays in the application. System default tags are applied to most agent attributes and some common SNMP (OID) attributes upon creation. You can always create or apply additional tags to any element to further identify each asset.
- Click on the Save button.
Note: To save time when configuring multiple similar CIs, use a Blueprint.
Edit an Attribute:
- In the Description column, click on the name of the Attribute you want to edit.
- If an Attribute is associated with a Blueprint, the Blueprint name precedes the Attribute name and not all fields are editable–such as the operation and type information. If you need to edit an Attribute associated with a Blueprint, select the Blueprint in the Configuration Field (step 3), and edit this Attribute.
- Edit the form. For more information about the Attribute fields, see Create Attribute.
- Click on the Save button.
Clone an Attribute:
- In the Navigation bar, select the appropriate CI and click on the Apply button, Attributes list refreshes for the selected CI.
- In the Description column, click on the name of the Attribute you want to clone.
- Edit the form. For more information about the Attribute fields, see Create Attribute.
- Click on the Save button.
Delete Attribute
- In the Navigation bar, select the appropriate CI and click on the Apply button, Attributes list refreshes for the selected CI.
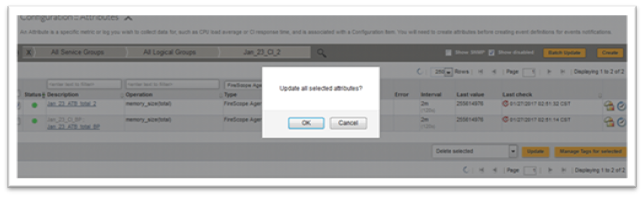
- In the Description column, check the box next to Attribute name you want to delete.
- From the drop-down in the bottom right corner of the page, select Delete selected.
- Click Update. A confirmation window will appears.Note: Deleting an Attribute will have a cascading delete effect. All elements that are based on this Attribute will be effected (for e.g. Dashboards, AEDs, ED, Policies etc.. Data collected by this Attribute will be lost for good.)
Types of Attributes
Types of attribute defines how FireScope SPM gather values for an attribute, it could be either through the FireScope Agent, SNMP or other means.
Agent Remote
In the case of Agent Remote attributes, the Edge Device does not request the values from the Agent, instead the Agent periodically (as configured in the Agent configuration file) retrieves the list of currently active Agent Remote attributes from the Edge Device. After retrieving the list of Agent Remote attributes, the Agent periodically sends the values for those attributes back to the Edge Device.
The "Agent Configuration File" refers to either the firescope_agentd_posix.xml or firescope_agentd_win.xml file.
This functionality is configured with following two properties in the FireScope Agent configuration file.
<!-- Agent should know which Edge Device has the list of agent remote attributes.
     This is configured in the Server property by adding the IP address of the
     Edge Device as the first entry in the command delimited list. -->
<prop>
    <key>Server</key>
    <value>10.0.12.64,10.0.12.61,10.22.121</value>
    <description>List of comma delimited IP addresses of FireScope servers. First entry is used for sending active checks.</description>
    <flags>0</flags>
</prop>
In the example above, the agent will only request a list of agent remote attributes from the edge device with the IP “10.0.12.64” because it is the first (or only) IP in the list.
The actual CI name should be set as the value for Hostname property. (Please note that the Hostname value is Case Sensitive)
<prop>
    <key>Hostname</key>
    <value>eas-cent67</value>
    <description>Unique hostname. Required for active checks and sentinel checks. For active checks, this unique host name must be same as the corresponding CI name.</description>
    <flags>0</flags>
</prop>
In order to make sure that everything is set up correctly, set the value of DebugLevel property as 5 in the Agent Configuration file.
<prop>
    <key>DebugLevel</key>
    <value>5</value>
    <description>Debug level for FireScope Agent. 0 – none, 1 – critical, 2 – error (default), 3 – warnings, 4 – info, 5 – debug (max info)</description>
    <flags>2</flags>
</prop>
Verify the following two items inside the Agent log file firescope_agentd.log
# This debug line indicates that the agent is requesting the list of Agent Remote attributes (Message sent: FSC_GET_ACTIVE_CHECKS) for the CI with the name “eas-cent67”.
|DEBUG |2016-02-03|11:49:17|Thread[ 1495]|[TcpSenderReceiver.cpp:250]| Message sent: FSC_GET_ACTIVE_CHECKS eas-cent67
A few lines below the FSC_GET_ACTIVE_CHECKS line, you should see the list of agent remote attributes and their “operation” field displayed.
|DEBUG |2016-02-04|11:07:55|Thread[236223207096]|[TcpSenderReceiver.cpp:146]| Received:agent_cpu_util:60:0:56b26a42ef134456164f344eagent_check:60:0:56b26de3ef13445e384f305c
In this case two operation are received which means there are two Agent Remote attributes configured for this CI.
Below is an example along with the description of Agent Remote Attribute.
| Operation | Description |
|---|---|
|
windows_eventvwr(logName[,filters]) return type: Log Type: Agent Remote |
Collects events from Microsoft Windows Eventlog subsystem. Parameters:
|
Example using multiple filters with a pipe (|) delimiter.
windows_eventvwr(security,Type:Infomation|Source:Microsoft Windows security|Category:12800|EventID:5156|Domain:firescope|User:N/A|Computer:N/A|Message:Junk)
Amazon AWS Attribute
| Operation | Description | Examples |
| amazon_aws_metric(namespace, instanceId, metric)return type:Numeric (float)Type: Amazon AWS Attribute Value returned is a float | Returns the current value of the specified AWS metricParameters:namespace = namespace of the target metricinstanceId = unique id of the target instancemetric = name of the metric | Example:amazon_aws_metric(AWS/EC2,i-f0016099,DiskReadOps)Returns the number of read operations for the specified instance |
Calculated Attribute
Calculated Attributes are metrics that FireScope SPM collects and evaluates against for events and performance. Calculated Attributes combine existing Attributes and logic that can include other Attributes.
To create a Calculated Attribute:# Create an Attribute. For more information, see Creating an Attribute. Specifically, set the following Data Collection Settings:
- In Type, select Calculated Attribute. The Calculated Attribute Builder section will be displayed.
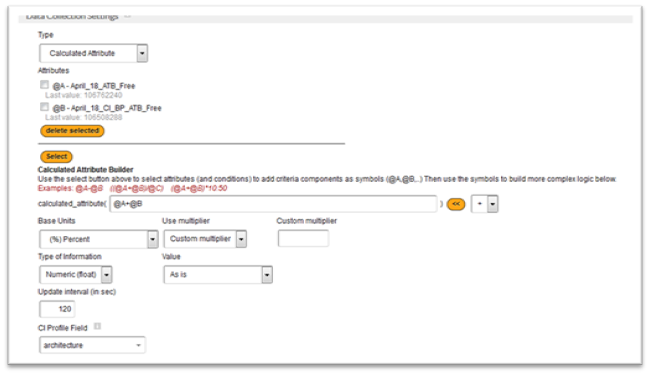
- In the Calculated Attribute Builder section, click Select. The Attribute pop-up window will be displayed.
- Check the box next to all the Attributes you want to use, you can select multiple attributes.
- Click Select. The Create Attribute page is updated with the selected Attributes. Each Attribute is represented as a variable.
- Select the appropriate math symbol(s) from the drop down box and click << to add the symbol to the expression.
- Base Units: Select base unit type appended to the end of all values for this Attribute whenever they are displayed. For example, (%) Percent for processor utilization, (B) Bytes for file system size, and (Bps) Bytes Per Second for network performance.
- Use multiplier: In case you want to convert the value mathematically before storing, such as converting bits to bytes, select Custom multiplier. Type the number to multiply in the Custom multiplier field.
- Type of Information: Format of values that will be returned by this Attribute.
- Value: Option to find how much a value has changed since the last time this Attribute was queried. In this case, select Delta (speed per second) or Delta (simple change) to have FireScope SDDM only record these values. Select As is to record the actual value.
- Update interval (in sec): This field determines how often, in seconds, FireScope SDDM should retrieve or listen for new data.E.g. Enter 60 to check every minute, 3600 for once an hour, or 86400 for once a day.
- CI Profile Field: Name of a field (default or custom) to update for this CI’s profile section. This feature is useful for selecting certain attributes as asset or CMDB information for a particular CI.
- Click on the Save button.
Cisco UCS
| Operation | Description | Examples |
| cisco_ucs_stat(dn, classname, statname)return type: CharacterType: Cisco UCSValue returned is stat dependent | Returns the latest stat value for the specified dn and classnameParameters:dn = distinguished nameclassname = UCS class name statname = name of the stat | Example: cisco_ucs_stat(sys/chassis-1/blade-1/board/cpu-1/env-stats,processorEnvStats, temperature)Returns temperature of cpu-1 in blade-1 |
Collecting Log Data(Windows Event Viewer, Application Logs)
FireScope SPM is capable of aggregating any standard OS or application log file and parsing it for Events. As log entries are sent to SPM, the entire log entry is stored as an Attribute. From this, you can create Event Definitions using simple text matches or complex regular expressions.
Before You Begin
- Install the FireScope Agent on the asset where the log file is stored.
- Ensure that the FireScope Agent has access to the asset’s file system in order to read the log file.
- Create a CI for the asset. For more information, see Creating a Configuration Item.
Application Logs:
- Log in to FireScope SPM as a FireScope or Configuration Administrator.
- Click Configuration > CIs > Attributes. The Attributes page displays the Attributes for the selected CI (in the top right corner).
- In Configuration Item, select the CI you want to create the Attribute for.
- Click Create. The Create Attribute page will be displayed.
- In Description, enter a descriptive name for the log file.
- In the Data Collection Settings section
- In Type, select Agent Remote.
- In Operation, type filesystem_logreader(<path to log file>, <optional parameters>). Refer to the table below for an example.
- In Type of Information, select Log.
- Complete the rest of the form. For more information about the Attribute fields, see Creating an Attribute.
- Click Save. All log entries for this asset will now be collected, associated with this Attribute, and stored as text-based data.
Example
| Examples: |
| filesystem_logreader(/var/log/boot.log, ORA,1234) |
| filesystem_logreader(c:\Windows\setuplog.txt) |
Windows Event Logs
For Microsoft Windows event logs, the process differs in one way. In Operation, type windows_eventvwr(<name of event log>,<optional filter with regex pattern>).
Log name: application, security, system, Optional Filter: Here are the only valid values for <optional filter>:Type, Source, Category, EventID, Domain, User, Computer, Message. Filters are delimited by pipe ‘|’.Example: windows_eventvwr(system) configures SPM to read the System Event Log.
Example:windows_eventvwr (security,Type:Infomation|Source:Microsoft Windows security|Category:12800|EventID:5156|Domain:firescope|User:N/A|Computer:N/A|Message:Junk) Note: You do not need to know the exact path for event logs.
Once this data is being collected, you can also quickly access the log entries via the search feature.
Days to Target Attribute
| Operation | Description | Examples |
| days_to_target(operation,targetValue,type)return type: Numeric (integer 64bit)Type: Days to Target AttributeValue return is Long | Returns the predicted number of days for the specified attribute to reach the specified targetParameters:operation= operation of the target attributetargetValue = target value (can be any value)type = one of above, below. Default is above | Example:days_to_target(“infoblox_range(range/ ZG5zLmRoY3BfcmFuZ2UkMTAuMC 4xMy4xLzEwLjAuMTMuMjM5Ly8vMC8x, percentActive)”,90) Returns the predicted number of days until the specified attribute hits 90 |
Derived Check
| Operation | Description | Examples |
| firescope_db(attributes)return type: Numeric (integer 64bit)Type: Derived Check | Number of attributes in the FireScope database | |
| firescope_db(attributes_disabled)return type: Numeric (integer 64bit)Type: Derived Check | Disabled Attribute count | A count of all disabled attributes for all accounts in the system |
| firescope_db(attributes_enabled)return type:Numeric (integer 64bit)Type: Derived Check | Enabled Attribute count | A count of all enabled attributes for all accounts in the system |
| firescope_db(attributes_unsupported)return type:Numeric (integer 64bit)Type: Derived Check | Number of unsupported attributes in the FireScope database | |
| firescope_db(cis)return type: Numeric (integer 64bit)Type: Derived Check | Total CI count | A count of all CI’s for all accounts in the system |
| firescope_db(cis_disabled)return type: Numeric (integer 64bit)Type: Derived Check | Disabled CI count | A count of all disabled CI’s for all accounts in the system |
| firescope_db(cis_enabled)return type: Numeric (integer 64bit)Type: Derived Check | Enabled CI count | A count of all enabled CI’s for all accounts in the system |
| firescope_db(eventdefs)return type: Numeric (integer 64bit)Type: Derived Check | Number of event definitions in FireScope database |
Dynamic Data Attributes
FireScope offers the Dynamic Data Attribute (DDA), which allows you to send data from your system to FireScope SPM proactively, as opposed to FireScope SPM polling your system for data. This method requires you to configure your system to send data via Transmission Control Protocol (TCP).
You can use this tool as the need arises to send as much data as you like. You can send single or multiple Attributes at once. You also determine the schedule and frequency for sending data using the DDA.
To make it easier to get started with Dynamic Data Attributes, we have sample scripts in Powershell, and in Python.
Creating the TCP Message
To use the DDA, you must send a TCP message via port 8043, with the following tags and variables. The message format will differ depending on the type of DDA you want to use (see the subsequent sections).
| Tag/Variable | Description |
| FSCP_PAYLOAD# | Alerts FireScope SPM that the following is an fs_incoming message.This tag is required to start an inbound message. |
| <ATTRS></ATTRS> | Denotes multiple Attributes. Include <ATTRS> before the first <ATTR> tag and </ATTRS> after the last </ATTR> tag. |
| <ATTR></ATTR> | Denotes an Attribute. |
| CIname | Name of the required CI. |
| operation | Unique operation of the Attribute for this CI (i.e., fs_incoming(status) where status can be replaced with any descriptive and unique value for the Attribute to collect). |
| value | Value of the Attribute (e.g., 42, “Success”), which must match the data type of the Attribute that is in the template (e.g., JSON, integer, float, character). |
| timestamp | Time stamp value of the actual time (seconds from epoch) that the value sample occurred.Timestamp is optional. When timestamp is omitted, the time FireScope received the value is used. |
There are two types of DDAs:* Incoming – For sending data elements to view, search, and graph in FireScope SPM.
- JSON – For sending associated data elements that will be correlated in FireScope SPM. You can view, search, and graph this data too.
The following sections provide examples of each DDA type.
Incoming
The basic template for an Incoming DDA message is:FSCP_PAYLOAD#<ATTRS><ATTR>CIname,operation,value,timestamp</ATTR></ATTRS>
The following example message illustrates a CI named myCI with an Attribute using the fs_incoming(status) operation:FSCP_PAYLOAD#<ATTRS><ATTR>myCI,fs_incoming(status),”Failed”</ATTR></ATTRS>
Here is the same example as above, plus the time stamp:FSCP_PAYLOAD#<ATTRS><ATTR>myCI,fs_incoming(status),”Failed”,1349297031</ATTR></ATTRS>
To send multiple attributes, use the following examples for guidance.
Example 1
The following Incoming DDA message is formatted to send four separate Attributes at once.FSCP_PAYLOAD#<ATTRS><ATTR>myCI,fs_incoming(A1),12345</ATTR><ATTR>myCI,fs_incoming(A2),753861.001</ATTR><ATTR>myCI,fs_incoming(A3),60812</ATTR><ATTR>myCI,fs_incoming(status),Success,1349297031</ATTR></ATTRS>
Example 2
This example shows another way to format an Incoming DDA message. This message sends two Attributes.
FSCP_PAYLOAD#<ATTRS><ATTR><CINAME>myCI</CINAME><OPERATION>fs_incoming(A1)</OPERATION><VALUE>12345</VALUE><TIMESTAMP>5678</TIMESTAMP></ATTR><ATTR><CINAME>myCI</CINAME><OPERATION>fs_incoming(A2)</OPERATION><VALUE>12345</VALUE><TIMESTAMP>5678</TIMESTAMP></ATTR></ATTRS>
| Operation | Description | Examples |
| fs_incoming_json(uniqueTag)return type: JSONType: Attribute JSON IncomingValue is a JSON payload | An attribute with JSON payload which allows incoming TCP message to update its valueParameters:uniqueTag= any value that can be used to uniquely identify this attribute | Example: fs_incoming_json(service1) |
JSON
If you want to send correlated data to FireScope SPM, use the JSON DDA. With JSON formatting, you can send multiple pieces of data from your system and ensure that those pieces of data will be correlated and available for viewing, searching, and graphing in FireScope SPM.
For example, you want to find all the transactions that completed successfully but exceeded your elapsed time threshold. To accomplish this, create a JSON DDA with the following data elements:* Transaction ID
- Status
- Error Code
- Elapsed Time
The following example is a message in JSON format that will send correlated data to FireScope SPM:FSCP_PAYLOAD#<ATTRS> <ATTR> <CINAME>myCI</CINAME> <OPERATION>fs_incoming_json(J1)</OPERATION> <VALUE>{“transactionid”:11111,”status”:”Success”,”elapsedtime”:10,”errorcode”:400}</VALUE> <TIMESTAMP>5678</TIMESTAMP> </ATTR></ATTRS>
Note: You can also format a basic Incoming DDA message in the JSON DDA format.
| Operation | Description | Examples |
| fs_incoming_json(uniqueTag)return type: JSONType: Attribute JSON IncomingValue is a JSON payload | An attribute with JSON payload which allows incoming TCP message to update its valueParameters:uniqueTag= any value that can be used to uniquely identify this attribute | Example:fs_incoming_json(service1) |
Using the Dynamic Data Attribute in FireScope SPM
Once you send data using the DDA, you can view, search, and graph it just like any other system data you use in FireScope SPM. Each of the following sections gives you more information about the ways you can use the data you submitted via the DDA.
Attribute
To use the DDA in CIs and Templates, create an Attribute in FireScope SPM and:# In Type, select the Attribute type you are creating from the following options:
- Attribute Incoming
- Attribute JSON Incoming
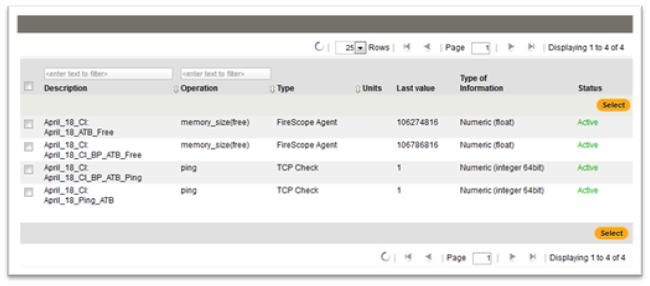
Once the Attribute is populated with data, the Last Value is displayed on the Attributes page. When you click the link in the Last Value column, a pop-up window displays more information.
Note: You can also create CIs, Logical Groups, and Service Groups, and link CIs to Templates and Groups via FireScope’s REST API.
Event Definition
The following two screen shots show the JSON DDA used in an Event Definition.* Configuration for an Event Definition using the JSON DDA
Visual Controls
Visual Controls are available with data obtained by the DDA just as they are for any data in FireScope SPM.
Reports
You can use the Reports in FireScope SPM to present your data obtained through DDA in an organized, meaningful way.
Firescope Agent
Following screen shot shows Firescope Agent Attributes collecting data.
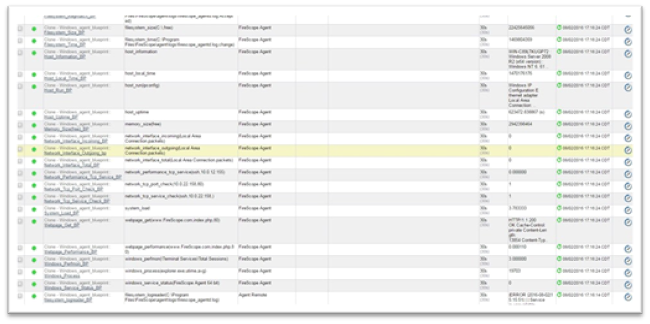
Following is a list of all the agent attributes available.
| Operation | Description | Parameters | Win32/64 | Linux | Solaris | AIX |
|---|---|---|---|---|---|---|
| agent_attribute_timeoutsreturn type: Numeric (integer 64bit) | Number of Attribute process timeouts in the last 1-Minute Measure of Attribute operation executions that time out | ✅ | ✅ | ✅ | ✅ | |
| agent_avg_processing_timereturn type: Numeric (float)Valuesin seconds | Average time spent processing Attributes in the last 1-Minute Per attribute processing time average for all attributes in the past 1 minute | ✅ | ✅ | ✅ | ✅ | |
| agent_checkreturn type: Numeric (integer 64bit)Values: 0 (Failed) , 1 (OK) | Check the availability of agent Checks whether the agent port (default 8042) is listening | ✅ | ✅ | ✅ | ✅ | |
| agent_cpu_utilreturn type: Numeric (float)Values in percentage | CPU utilization generated by the FireScope Agent Percentage of total processor utilization by FireScope Agent. | ✅ | ✅ | ✅ | ✅ | |
| agent_current_versionreturn type: Character | Version of Agent running o n host An Example of returned value is: 3.0.1 | ✅ | ✅ | ✅ | ✅ | |
| agent_failed_attributesreturn type: Numeric (integer 64bit) | Number of failed attributes processed in last 1 Minute Failed Attributes are Operations that are valid but are not supported by a particular OS or Host. EX: checking drive space on F: drive when that drive letter does not exist | ✅ | ✅ | ✅ | ✅ | |
| agent_invalid_attributesreturn type: Numeric (integer 64bit) | Number of Invalid Attribute Operations in the last 1-Minute Invalid Attributes are the result of bad Operation Syntax (operation_) | ✅ | ✅ | ✅ | ✅ | |
| agent_memory_utilreturn type: Numeric (integer 64bit)Value in Bytes | Memory consumed by FireScope Agent | |||||
| agent_store_and_fwdreturn type: Numeric (integer 64bit)Values: 0 (disabled) or 1 (enabled) | Is Agent Batch Mode enabled Used to determine if Agent storing values to be forwarded to FireScope Appliance at a later time. Used for slow / WAN links | ✅ | ✅ | ✅ | ✅ | |
| agent_stored_bufferreturn type: Numeric (integer 64bit) | Number of attributes stored in the buffer to be sent to Appliance Configure number of attribute values queued before forwarding to FireScope Appliance | ✅ | ✅ | ✅ | ✅ | |
| agent_successful_attributesreturn type: Numeric (integer 64bit) | Number of successful attributes processed in last 1 Minute Attributes Operations that succeed whose values are forwarded to the Appliance | ✅ | ✅ | ✅ | ✅ | |
| agent_tcp_sessions(type) return type: Numeric (integer 64bit) |
TCP Session Information. Parameters:type = one of listen, established, synsent,synrecv, finwait1, finwait2, timewait,close, closewait, lastack, closing Provides TCP Session information for the FireScope Agent |
|||||
| type | listen | ✅ | ✅ | ✅ | ❌ | |
| established | ✅ | ✅ | ✅ | ❌ | ||
| synsent | ✅ | ✅ | ✅ | ❌ | ||
| synrecv | ✅ | ✅ | ✅ | ❌ | ||
| finwait1 | ✅ | ✅ | ✅ | ❌ | ||
| finwait2 | ✅ | ✅ | ✅ | ❌ | ||
| timewait | ✅ | ✅ | ✅ | ❌ | ||
| close | ✅ | ✅ | ✅ | ❌ | ||
| closewait | ✅ | ✅ | ✅ | ❌ | ||
| lastack | ✅ | ✅ | ✅ | ❌ | ||
| closing | ✅ | ✅ | ✅ | ❌ | ||
| deletetcb | ✅ | ❌ | ❌ | ❌ | ||
| idle | ❌ | ❌ | ✅ | ❌ | ||
| bound | ❌ | ❌ | ✅ | ❌ | ||
| agent_thread_countreturn type: Numeric (integer 64bit) | Number of threads spawned by FireScope Agent Value is total number of threads being used by FireScope Agent agent_buildtag | ✅ | ✅ | ✅ | ✅ | |
| agent_buildtag | Returns the current build tag | ✅ | ✅ | ✅ | ✅ | |
| cpu_interruptsreturn type: Numeric (integer 64bit) | Number of Device interrupts. Will display the number of context switches currently inuse. | ❌ | ✅ | ✅ | ✅ | |
| cpu_switchesreturn type: Numeric (integer 64bit) | Context switches. | ❌ | ❌ | ✅ | ✅ | |
| cpu_utilization([cpu] [,type] [,parameters]) return type: Numeric (float)Values in percentage |
CPU(s) utilization. Parameters:
|
✅ | ✅ | ✅ | ✅ | |
| type | idle | ❌ | ✅ | ✅ | ✅ | |
| nice | ❌ | ✅ | ❌ | ❌ | ||
| user | ❌ | ✅ | ✅ | ✅ | ||
| kernel | ❌ | ❌ | ✅ | ❌ | ||
| wait | ❌ | ❌ | ✅ | ✅ | ||
| system | ✅ | ✅ | ❌ | ✅ | ||
| parameters | avg1 | ✅ | ✅ | ❌ | ✅ | |
| avg5 | ✅ | ✅ | ❌ | ✅ | ||
| avg15 | ✅ | ✅ | ❌ | ✅ | ||
| filesystem_checksum(file) return type: Numeric (integer 64bit) |
Calculate file check sum. Parameters:file = full path to file Example of returned value:1938292000 Example:filesystem_checksum(/etc/passwd) |
✅ | ✅ | ✅ | ✅ | |
| filesystem_device_read(device [,type]) return type: Numeric (integer 64bit) |
Disk read statistics. Parameters:
|
❌ | ✅ | ✅ | ❌ | |
| type | sectors | ❌ | ✅ | ❌ | ❌ | |
| operations | ❌ | ✅ | ✅ | ❌ | ||
| bytes | ❌ | ❌ | ✅ | ❌ | ||
| filesystem_device_write(device [,type]) return type: Numeric (integer 64bit) |
Disk write statistics. Parameters:
|
❌ | ✅ | ✅ | ❌ | |
| type | sectors | ❌ | ✅ | ❌ | ❌ | |
| operations | ❌ | ✅ | ✅ | ❌ | ||
| bytes | ❌ | ❌ | ✅ | ❌ | ||
| filesystem_file_exists(file) return type: Numeric (integer 64bit) Values: 0 (file does not exist), 1 (file exists) |
Check if file exists Parameters:file = full path to file Example:filesystem_file_exists(/tmp/application.pid) |
✅ | ✅ | ✅ | ✅ | |
| filesystem_file_md5sum(file) return type: CharacterType: FireScope AgentMD5 hash of the file. Can be used only for files less than 64MB, unsupported otherwise. |
File’s MD5 check sum Example of returned value:b5052decb577e0fffd622d6ddc017e82 Example:filesystem_file_md5sum(/etc/FireScope/ FireScope_agentd.conf) |
✅ | ✅ | ✅ | ✅ | |
| filesystem_filesize(file) return type: Numeric (integer 64bit)Values in bytes |
Return size of specified fileValue returned in bytes Parameters:filesize = full path to file. The file must have read permissions for user FireScope Example:filesystem_filesize(/var/log/syslog) |
✅ | ✅ | ✅ | ✅ | |
| filesystem_filesystemsreturn type: CharacterValue returnedas a comma separated list | Drives/Filesystems currently mapped/mounted Parameters:None |
|||||
| filesystem_inode(filesystem [,parameters]) return type: Numeric (float)Type: FireScope Agent |
Number of inodes Parameters:parameters – one of total [default], free, used, pfree[free, percentage], pused [used, percentage] |
system | ✅ | ✅ | ❌ | ✅ |
| parameters | total | ❌ | ✅ | ✅ | ✅ | |
| free | ❌ | ✅ | ✅ | ✅ | ||
| used | ❌ | ✅ | ✅ | ✅ | ||
| pfree | ❌ | ✅ | ✅ | ✅ | ||
| pused | ❌ | ✅ | ✅ | ✅ | ||
| filesystem_logreader(fullpath) | ✅ | ✅ | ✅ | ✅ | ||
| filesystem_regexpression(file, regex) return type: Character |
Find string in a file name. Parameters:file = full path to file, regex = GNU regular expression Example:filesystem_re |
✅ | ✅ | ✅ | ✅ | |
| filesystem_regmatch(file, regex) return type: Numeric (integer 64bit) Values: 0 (expression not found), 1 (expression found) |
Find string in a file name. |
✅ | ✅ | ✅ | ✅ | |
| filesystem_size(fs [,parameters]) return type: Numeric (float)Values in Kbytes |
Disk space. Parameters:parameters – one of total [default], free, used, pfree [free, percentage], pused [used, percentage] In case of a mounted volume, disk space for local file system is returned. |
✅ | ✅ | ✅ | ✅ | |
| parameters | total | ✅ | ✅ | ✅ | ✅ | |
| free | ✅ | ✅ | ✅ | ✅ | ||
| used | ✅ | ✅ | ✅ | ✅ | ||
| pfree | ✅ | ✅ | ✅ | ✅ | ||
| pused | ✅ | ✅ | ✅ | ✅ | ||
| filesystem_time(file[, parameters]) return type: Numeric (integer 64bit)Values in seconds |
File time information. Parameters:file = full path to fileparameters = one of modify [default, modification time], access = last access time, change = last change time Example:filesystem_time(/etc/passwd,modify) |
✅ | ✅ | ✅ | ✅ | |
| parameters | modify | ✅ | ✅ | ✅ | ✅ | |
| access | ✅ | ✅ | ✅ | ✅ | ||
| change | ✅ | ✅ | ✅ | ✅ | ||
| host_boottimereturn type: Numeric (integer 64bit) | Unix time when the machine was booted | ❌ | ✅ | ❌ | ❌ | |
| host_connected_usersreturn type: Numeric (integer 64bit) | Number of users connected. Counts number of users currently connected to host | ❌ | ✅ | ✅ | ✅ | |
| host_informationreturn type: Character | Returns detailed host information. Example of returned value:FreeBSD localhost 4.4-RELEASE FreeBSD 4.4-RELEASE #0: Tue Sep 18 11:57:08 PDT 2001 murray@builder.FreeBSD.org: /usr/src/sys/compile/GENERIC i386 |
✅ | ✅ | ✅ | ✅ | |
| host_local_timereturn type: Numeric (integer 64bit)Values in seconds | System local time returned as the number of seconds since Jan 1, 1970 | ✅ | ✅ | ✅ | ✅ | |
| host_namereturn type: Character | Returns the name of the host. Example of returned valuewebserv01.firescope.com |
✅ | ✅ | ✅ | ✅ | |
| host_run(command[,parameters]) return type: Character |
Run specified command on the host. Parameters:command = command for executionparameters = one of wait [default, wait end of execution],nowait [do no wait] Example:host_run[ls -l /] – detailed file list of root directory.Note:To enable this functionality, agent configuration file must have EnableRemoteCommands=1 option. |
✅ | ✅ | ✅ | ✅ | |
| parameters | wait | ✅ | ✅ | ✅ | ✅ | |
| nowait | ✅ | ✅ | ✅ | ✅ | ||
| host_uptimereturn type: Numeric (float)Values in seconds | System’s uptime in seconds. Use Units s or uptime to get readable values. | ✅ | ✅ | ✅ | ❌ | |
| jmx_delegate(parm) return type: CharacterType: FireScope AgentJMX attribute value |
Collect JMX value Parameters:parm = JMX attribute |
✅ | ✅ | ✅ | ✅ | |
| memory_size([parameters]) return type: Numeric (float) Values in bytes |
Memory size. Parameters:parameters – one of total [default], shared, total, buffers, cached, free, pfree, available |
✅ | ✅ | ✅ | ✅ | |
| parameters | total | ✅ | ✅ | ✅ | ✅ | |
| shared | ❌ | ✅ | ❌ | ❌ | ||
| buffers | ❌ | ✅ | ❌ | ❌ | ||
| free | ✅ | ✅ | ✅ | ✅ | ||
| pfree | ✅ | ✅ | ✅ | ✅ | ||
| used | ❌ | ❌ | ❌ | ❌ | ||
| pused | ❌ | ❌ | ❌ | ❌ | ||
| cached | ✅ | ✅ | ❌ | ❌ | ||
| available | ❌ | ❌ | ✅ | ❌ | ||
| mongostat(insert) return type: CharacterValue is user specified |
Collect mongo statistics. Parameters:Valid column names are: insert, query, update, delete, getmore, command, flushes, mapped, vsize, res, faults, locked_%, idx_miss_%, qr, qw, ar, aw, netIn, netOut, conn, set, repl, time Example: mongostat(insert) |
✅ | ✅ | ✅ | ✅ | |
| mqseries_queue([queuemanager],queuename[,param]) return type: Numeric (integer 64bit) Value returned as count |
Returns statistics on an MQSeries queue Parameters:queuemanager = queue manager name, queuename = queue name, param = one of curdepth or maxdepth Example: mqseries_queue(myqueuemgr,myqueue,curdepth) |
❌ | ❌ | ✅ | ❌ | |
| parameters | curdepth | ✅ | ✅ | ✅ | ✅ | |
| maxdepth | ❌ | ❌ | ✅ | ❌ | ||
| mqseries_queuemanager(queuemanager) return type: CharacterReturns one of: Starting Running Quiescing Ending immediately Ending preemptively Ended normally Ended immediately Ended unexpectedly Ended preemptively |
Returns status of MQSeries queue manager. Parameters:queuemanager = queue manager name Example: mqseries_queuemanager(myqueuemanager) |
❌ | ❌ | ✅ | ❌ | |
| network_dns_availability(ipaddress, domain) return type: Numeric (integer 64bit)Values: 0 (DNS down), 1 (DNS up) |
Checks the availability of a DNS service. Parameters:ipaddress = IP address of DNS server. Domain- Domain to check on DNS Example:network_dns_availability (192.168.0.1,FireScope.com) |
❌ | ✅ | ✅ | ✅ | |
| network_interface_collision(interface) return type: Numeric (integer 64bit) |
Out-of-window collision. Total number of collisions for interface.An Example of returned value is: 55 | ❌ | ✅ | ✅ | ✅ | |
| network_interface_incoming(interface[, parameters]) return type: Numeric (integer 64bit) |
Incoming network statistics per interface. Parameters:parameters = bytes total number of bytes by interface. This is the default. Packets = total number of packets by interface. Errors = total number of errors by interface. Dropped – total number of dropped packets by interface. Example:network_interface_incoming(eth1,packets) This operation can be used with Delta (speed per second) in order to get bits per second statistics. |
✅ | ✅ | ✅ | ✅ | |
| parameters | bytes | ✅ | ✅ | ✅ | ✅ | |
| packets | ✅ | ✅ | ✅ | ✅ | ||
| errors | ✅ | ✅ | ✅ | ✅ | ||
| dropped | ✅ | ✅ | ❌ | ❌ | ||
| network_interface_outgoing(interface [,parameters]) return type: Numeric (integer 64bit) |
Outgoing network statistics per interface. Parameters:
Example:network_interface_outgoing(eth1,packets). You can combine this operation with Delta (speed per second) and get bits per second statistics per interface. |
✅ | ✅ | ✅ | ✅ | |
| parameters | bytes | ✅ | ✅ | ✅ | ✅ | |
| packets | ✅ | ✅ | ✅ | ✅ | ||
| errors | ✅ | ✅ | ✅ | ✅ | ||
| dropped | ✅ | ✅ | ❌ | ❌ | ||
| network_interface_total(interface[, parameters]) return type: Numeric (integer 64bit) |
Total network statistics per interface. Parameters:parameters = bytes total number of bytes by interface. This is the default. packets = total number of packets by interface. Errors = total number of errors by interface. Dropped – total number of dropped packets by interface Example:network_interface_total(eth1,packets) |
✅ | ✅ | ✅ | ✅ | |
| parameters | bytes | ✅ | ✅ | ✅ | ✅ | |
| packets | ✅ | ✅ | ✅ | ✅ | ||
| errors | ✅ | ✅ | ✅ | ✅ | ||
| dropped | ✅ | ✅ | ❌ | ❌ | ||
| network_listen(port) | ❌ | ❌ | ❌ | ❌ | ||
| network_performance_tcp_service(service [,ipaddress] [,port]) return type: Numeric (float)Values: 0 (service down), sec (number of seconds spent while connecting to service) |
Check performance of service Parameters:service = one of ssh, nntp, ldap, smtp, ftp, http, pop, imap, tcp, etcipadd = IP address [The default is 127.0.0.1]port – port number [by default standard service port number is used] Example:network.tcp.service.perf(ssh) = Used to test speed of initial response from SSH server. |
✅ | ✅ | ✅ | ✅ | |
| service | ssh | ✅ | ✅ | ✅ | ✅ | |
| nntp | ✅ | ✅ | ✅ | ✅ | ||
| ldap | ✅ | ✅ | ✅ | ✅ | ||
| smtp | ✅ | ✅ | ✅ | ✅ | ||
| ftp | ✅ | ✅ | ✅ | ✅ | ||
| http | ✅ | ✅ | ✅ | ✅ | ||
| pop | ✅ | ✅ | ✅ | ✅ | ||
| imap | ✅ | ✅ | ✅ | ✅ | ||
| tcp | ✅ | ✅ | ✅ | ✅ | ||
| network_tcp_port_check([ipaddress], port) return type: Numeric (integer 64bit)Values: 0 (cannot connect to port), 1 (can connect to port) |
Check, if it is possible to make TCP connection to the given port. Parameters:ipaddress = IP address. The default is 127.0.0.1port = The port number Example:network_tcp_port_check (192.168.0.1,80) = Can be used to test availability of WEB server running on port 80. |
✅ | ✅ | ✅ | ✅ | |
| network_tcp_service_check(service [,ipaddress] [,port]) return type: Numeric (integer 64bit)Values: 0 (service down), 1 (service running), 2 (timeout connecting) |
Check if service is running and accepting TCP connections. Parameters:"service = one of ssh, nntp, ldap, smtp, ftp, http, pop, imap, tcp, etcipaddress = IP address [the default is 127.0.0.1]" Example:network_tcp_service(ftp,,45) = Can be used to test availability of FTP server using TCP port 45. |
✅ | ✅ | ✅ | ✅ | |
| service | ssh | ✅ | ✅ | ✅ | ✅ | |
| nntp | ✅ | ✅ | ✅ | ✅ | ||
| ldap | ✅ | ✅ | ✅ | ✅ | ||
| smtp | ✅ | ✅ | ✅ | ✅ | ||
| ftp | ✅ | ✅ | ✅ | ✅ | ||
| http | ✅ | ✅ | ✅ | ✅ | ||
| pop | ✅ | ✅ | ✅ | ✅ | ||
| imap | ✅ | ✅ | ✅ | ✅ | ||
| tcp | ✅ | ✅ | ✅ | ✅ | ||
| number_processes([name] [,account] [,state][,commandline]) return type: Numeric (integer 64bit) |
Number of processes by name having state running under authenticated account Parameters:name = process nameaccount = account name [the default is all users]state = one of all [default], run, sleep, zombcommandline = filter by command line Example:number_processes [apache2,www-data] = The total number of apache2 processes running under the www-data accountnumber_processes [,oracle,sleep,oracleFireScope] = number of processes in sleep state running under oracle having oracleFireScope in its command line |
✅ | ✅ | ✅ | ✅ | |
| state | all | ✅ | ✅ | ✅ | ✅ | |
| run | ❌ | ✅ | ✅ | ✅ | ||
| sleep | ❌ | ✅ | ✅ | ✅ | ||
| zomb | ❌ | ✅ | ✅ | ✅ | ||
| idle | ❌ | ❌ | ❌ | ❌ | ||
| stopped | ❌ | ❌ | ❌ | ❌ | ||
| process_cpu(regex) return type: Numeric (float)Values in percentage |
CPU utilization of an individual process Parameters:regex = regex that should match the contents of the /proc//cmdline file Example: process_cpu(httpd) |
✅ | ✅ | ✅ | ✅ | |
| process_memory([processname] [,account] [,parameters][,commandline]) return type: Numeric (float) |
Total memory used by each process running under a given authenticated account Parameters:
Examples:
|
❌ | ✅ | ✅ | ✅ | |
| parameters | avg | ❌ | ✅ | ✅ | ✅ | |
| max | ❌ | ✅ | ✅ | ✅ | ||
| min | ❌ | ✅ | ✅ | ✅ | ||
| sum | ❌ | ✅ | ✅ | ✅ | ||
| swap_in([device] [,type]) return type: Numeric (integer 64bit) Swap statistics |
Swap in. Parameters:device – swap device (default is all),type – one of count (default, number of swapins), pages (pages swapped in), sectors (sectors swapped in) Example:system.swap.in(,bytes) |
✅ | ✅ | ✅ | ✅ | |
| type | count | ❌ | ✅ | ✅ | ❌ | |
| pages | ❌ | ✅ | ✅ | ❌ | ||
| sectors | ❌ | ✅ | ❌ | ❌ | ||
| swap_out([device] [,type]) return type: Numeric (integer 64bit) Swap statistics |
Swap in. Parameters:device – swap device (default is all),type – one of count (default, number of swapouts), pages (pages swapped out), sectors (sectors swapped out) Example:system.swap.out(,pages) |
❌ | ✅ | ✅ | ❌ | |
| type | count | ❌ | ✅ | ✅ | ❌ | |
| pages | ❌ | ✅ | ✅ | ❌ | ||
| sectors | ❌ | ✅ | ❌ | ❌ | ||
| swap_size([device] [,parameters]) return type: Numeric (float)Values in bytes or percentage |
Swap space. Parameters:device – swap device (default is all),type – one of free (default, free swap space), total (total swap space), pfree (free swap space, percentage), pused (used swap space, percentage) pfree and pused are Linux only Example:swap_size(,pfree) – returnspercentage of free swap spaceswap_size(,free) returns bytesof free swap space |
❌ | ✅ | ✅ | ✅ | |
| type | free | ✅ | ✅ | ✅ | ✅ | |
| used | ❌ | ❌ | ❌ | ❌ | ||
| total | ✅ | ✅ | ✅ | ✅ | ||
| pfree | ❌ | ✅ | ✅ | ✅ | ||
| pused | ❌ | ✅ | ✅ | ✅ | ||
| system_load([parameters]) return type: Numeric (float) |
Current load by CPU(s). Parameters:parameters = one of avg1 [default], avg5, avg15 (average within 15 minutes) Example:system_load(avg5) |
|||||
| parameters | avg1 | ✅ | ✅ | ✅ | ✅ | |
| avg5 | ✅ | ✅ | ✅ | ✅ | ||
| avg15 | ✅ | ✅ | ✅ | ✅ | ||
| webpage_get(host,[path],[port]) return type: Log |
Get content of WEB page Parameters:WEB page source as text Returns EOF on fail. Example:webpage_get(www.FireScope.com,index.php,80) |
✅ | ✅ | ✅ | ✅ | |
| webpage_performance(host,[path],[port]) return type: Numeric (float)Values in seconds |
Get timing of loading full WEB page Parameters:host – hostname, path – path to HTML document (default is /), port – port number (default is 80) Example:webpage_performance (www.FireScope.com, index.php,80) |
✅ | ✅ | ✅ | ✅ | |
| webpage_regexpression(host, [path], [port], [regexp], [length,) return type: Character |
Get first occurence of regexp in WEB page Parameters:host – hostname, path – path to HTML document (default is /), port – port number (default is 80), regexp – GNU regular expression, length – number of characters to return Example:webpage_regexpression(www.FireScope.com,index.php,80) |
✅ | ✅ | ✅ | ✅ | |
| windows_eventvwr(parm[,{custom}]) | ✅ | ❌ | ❌ | ❌ | ||
| parameters | application | ✅ | ❌ | ❌ | ❌ | |
| security | ✅ | ❌ | ❌ | ❌ | ||
| system | ✅ | ❌ | ❌ | ❌ | ||
| {custom} | ✅ | ❌ | ❌ | ❌ | ||
| windows_perfmon(parm) return type: Numeric (float) Microsoft Windows ONLY |
Value from Windows Perfmon metric Parameters:Path to Perfmon metric. See "typeperf" Windows command to locate Path Example: windows_perfmon(\Terminal Services\Total Sessions) |
✅ | ❌ | ❌ | ❌ | |
| windows_process(processName [,attribute] [,type]) return type: Numeric (integer 64bit) Microsoft Windows ONLY |
Information on specific Windows Processes Parameters:processName = process nameattribute = one of vmsize,wkset, pf,ktime, utime, gdiobj, userobj, io_read_b, io_read_op, io_write_bio_write_opio_other_b, io_other_optype = one of min,max,avg,sum Example:windows_process(outlook.exe,utime,avg) |
✅ | ❌ | ❌ | ❌ | |
| attribute | vmsize | ✅ | ❌ | ❌ | ❌ | |
| wkset | ✅ | ❌ | ❌ | ❌ | ||
| pf | ✅ | ❌ | ❌ | ❌ | ||
| ktime | ✅ | ❌ | ❌ | ❌ | ||
| utime | ✅ | ❌ | ❌ | ❌ | ||
| gdiobj | ✅ | ❌ | ❌ | ❌ | ||
| userobj | ✅ | ❌ | ❌ | ❌ | ||
| io_read_b | ✅ | ❌ | ❌ | ❌ | ||
| io_read_op | ✅ | ❌ | ❌ | ❌ | ||
| io_write_b | ✅ | ❌ | ❌ | ❌ | ||
| io_write_op | ✅ | ❌ | ❌ | ❌ | ||
| io_other_b | ✅ | ❌ | ❌ | ❌ | ||
| io_other_op | ✅ | ❌ | ❌ | ❌ | ||
| type | min | ✅ | ❌ | ❌ | ❌ | |
| max | ✅ | ❌ | ❌ | ❌ | ||
| avg | ✅ | ❌ | ❌ | ❌ | ||
| sum | ✅ | ❌ | ❌ | ❌ | ||
| windows_service_status(Service) return type: Numeric (integer 64bit) Microsoft Windows ONLY Values: 0 (running), 1 (paused), 2 (start pending), 3 (pause pending), 4 (continue pending), 5 (stop pending), 6 (stopped), 7 (unknown), 255 (error) |
Status of Windows ServiceNOTE: Microsoft Windows ONLY Parameters:Must be the "Service name" as displayed on the General tab in Windows Service Control Panel Example:Service Name: Spoolerwindows_service_status(Spooler |
✅ | ❌ | ❌ | ❌ | |
| wmi_delegate(parm) | ✅ | ❌ | ❌ | ❌ |
Group Checked Attribute
Grouped Check Attributes let you group and perform calculations on the same Attribute across multiple Configuration Items (CIs) within a single Logical Group. Multiple functions are supported, including averaging the current attribute value, identifying the maximum or minimum current value, and adding the values together for a group sum. This allows you to define a single event trigger that monitors a metric across multiple CIs, which is especially useful in web farm scenarios. As add or remove CIs from the Logical Group specified, you do not need to modify the Grouped Check Attribute.
Grouped Checks are ideal for scenarios where all CIs in the Logical Group are similar models of hardware, software, and production utilization.
Format
The format for a Grouped Check Attribute is as follows:grouped_operation(group,operation,function,parm)
The following table describes each variable used in the Grouped Check Attribute operation:
| Variable | Description |
| group | Existing Logical Group. |
| operation | Exact operation syntax of the Attribute you’re grouping. |
| function | Operator that works with the parameter to determine how many samples or over what time period you want to calculate. |
| parm | Parameter–time period or number of samples. |
Variable
Supported Operations
The following operations are supported with the Grouped Check Attribute:
| Operation | Description |
| grouped_average | Average of the values taken for the group. |
| grouped_maximum | Maximum value of those taken for the group. |
| grouped_minimum | Minimum value of those taken for the group. |
| grouped_sum | Sum of the values taken for the group. |
Supported Functions
The following functions are supported in the Grouped Check Attribute operations:
| Function | Description |
| avg | Average value. |
| count | Number of values. |
| last | Last value. |
| max | Maximum value. |
| min | Minimum value. |
| sum | Sum of values. |
Examples
Additional examples of keys for Grouped Check Attributes: * Example 1: Total disk space of Logical Group ‘MySQL Servers’ grouped_sum(“MySQL Servers”,”vfs.fs.size[/,total]”,”last”,”0″)
- Example 2: Average processor load of Logical Group ‘MySQL Servers’ grouped_average(“MySQL Servers”,”system.cpu.load[,avg1]”,”last”,”0″)
- Example 3: Average (5min) number of queries per second for Logical Group ‘MySQL Servers’ grouped_average(“MySQL Servers”,”mysql.qps”,”avg”,”300″)
Infoblox Attribute
| Operation | Description | Examples |
| infoblox_range(ibRef, statname)return type: CharacterType:Infoblox AttributeValue returned is stat dependent | Returns the latest range stat value for the specified ibRefParameters:ibRef= id of the rangestatname = percentActive, totalSize, totalActive, totalFree | Example: infoblox_range(range/ZG5zLmRoY3BfcmFuZ2UkMTAuMC4xMy4xLzEwLjAuMTMuMjM5Ly8vMC8x,percentActive)Returns the percent of Active leases for the specified range |
JMX
JMX is a Java standard for monitoring and managing applications written in the Java development language. JMX supports distributed monitoring and management capabilities and allows access to JMX attributes and operations via a variety of access protocols.
Firescope leverages the access capabilities made available in JMX to deliver the ability to monitor or manipulate many JMX data attributes or operations. In order to deliver these capabilities several configurations must be initiated. The following document is intended to guide you through the necessary configurations required to enable JMX capabilities for use with the FireScope appliance.
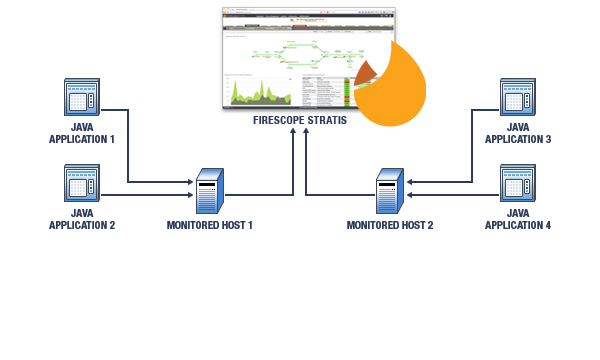
Firescope JMX Monitoring Architecture
The figure below details a simple FireScope appliance monitoring two hosts, each of which houses two Java applications.
Configuration Summary The following points highlight the necessary steps required for JMX monitoring with FireScope:* Configure your Java virtual machine (JVM) to allow access to its MbeanServer.
- Use JConsole if necessary to discover deployed Mbean names, attribute names and operation names.
- Create new UserParameters in your remote FireScope agent which will in turn make invocations through the jmxdelegate.jar file to interact with your targeted JMX beans.
- Create items on the FireScope server which reference the newly created UserParameters.
JVM Configuration
Each JVM that will be monitored must be configured to allow access to the JMX server that runs inside of each monitored JVM. Configuration is accomplished by providing a few system parameters to the JVM upon application startup. The parameters are listed below along with their description.
| Parameter | Value Type | Example | Description | Required |
| com.sun.management.jmxremote | None | Instruct the JVM to enable remote JMX access | Yes | |
| com.sun.management.jmxremote.port | Numeric | 3900 | Server port that JMX server allows access on. | Yes |
| com.sun.management.jmxremote.authenticate | Boolean | 0 | Currently authenticated access is not supported. | Yes |
Example:/ /java -Dcom.sun.management.jmxremote -Dcom.sun.management.jmxremote.port=3306 -Dcom.sun.management.jmxremote.authenticate=false
Warnings: * Each configured Java virtual machine must use a separate port configuration.
- Configured ports must not conflict with any ports currently in use on the system being configured.
- Use netstat to ensure valid selection of configured ports.
- On Unix / Linux systems use ports > than 1000
Use netstat prior to starting or restarting your application to ensure that the configured port is not in use. Restart your Java application using the new configuration. Then run netstat again to ensure that the system reports a listening port on the selected configuration port.
JMX Discovery
JConsole is a JVM monitoring application that has been in existence since the release of Java JDK 1.5.x. With JConsole it is possible to explore all JMX managed beans in a virtual machine once the JVM is configured to allow JMX remote access as described above. The JConsole executable can be found in the bin directory for your JDK1.5.x or greater installation.
Launch JConsole and select the “Remote Process” option button. Enter “localhost: ” in the entry text box, where the port is the configured JMX listener port. Then select the “Connect” button.
Once started, JConsole will display several tabs. Select the “Mbeans” tab. Along the left hand side is a tree view that lists each deployed Mbean in the JMX Managed Bean Server. The treeview allows exploring down to each Mbean and displays each Mbean attribute or operation. Once you have navigated down to the bean level JConsole will display the Mbean name in the display on the right hand side.
Notes:* JConsole is not required for use with the FireScope monitoring. It is described here for the user’s understanding and for exploring beans deployed to your Mbean server.
- JConsole is part of the JDK download, not the JRE.
- All Mbeans are uniquely identified by name.
- In order to access the attributes or operations of an Mbean you must reference the bean using its unique name.
- In order to maintain uniqueness in names servers such as Tomcat and JBoss, use complex nested names.
Individual JMX Attribute Access
FireScope makes available a client access tool called jmxdelegate for querying and setting individual Mbean attributes and invoking Mbean operations. As described above, the JConsole utility can be used to determine the names and attributes of Mbeans deployed in a particular java virtual machine. The bean names, attributes names and operation names are passed to the jmxdelegate tool for access.
First deploy the jmxdelegate.jar file to an appropriate location on your monitored system. The following example uses a bean names from a system that has a default Tomcat version 6.0.13 deployed running and configured for JMX access.
The jmxclient tool uses the following command format:/java -Dhost= -Dport= -DbeanName= -Dattribute= -Dparameters= -DnestedResult= -jar /jmxdelegate.jar
| Parameter | Required | Description |
| Yes | Path to the Java VM executable file | |
| Yes | Host for JMX access. Typically is localhost. | |
| Yes | Port for JMX access. | |
| Yes | Name of the managed bean of interest obtained via JConsole. | |
| No | Name of the manager bean attribute or operation of interest obtained via JConsole. | |
| No | The attribute or operation parameters if any | |
| No | The name of a sub-element in a CompositeResult. |
The following example command line will retrieve the requestCount? Attribute from the deployed tomcat manager application that comes as a part of the standard Tomcat deployment:
/java -Dhost=localhost -Dport=3306 -DbeanName= Catalina:j2eeType=Servlet,name=HTMLManager,WebModule=//localhost/manager,J2EEApplication=none,J2EEServer=none -Dattribute=requestCount -jar jmxdelegate.jar
Note the nested / complex bean name created by Tomcat shown again as follows:Catalina:j2eeType=Servlet,name=HTMLManager,WebModule=//localhost/manager,J2EEApplication=none,J2EEServer=none
Invoking the above command returns the current requestCount.
Now invoke the manager via a web browser as follows: http://localhost:8080/manager/html
Then re-invoke jmxclient tool to show that the request count increases with each manager invocation.
Example of FireScope JMX Managed Beans
The FireScope solution is delivered with an application called SyslogListener. The SyslogListener application receives syslog messages over TCP/IP and transfers these messages to the FireScope database. The SyslogListener application contains a few managed beans which expose some data points which may be of interest to FireScope users. The exposed beans are described in the following table:
| Bean Name | Bean Attribute / Operation | Description |
| com.firescope.sysloglistener:name=ReceiveMessageCount | PerMinuteMessageCount | Number of messages received during the last minute of operation |
| com.firescope.sysloglistener:name=ReceiveMessageCount | DailyMessageCount | Cumulative number of messages received since midnight |
| com.firescope.sysloglistener:name=PersistedMessageCount | PerMinuteMessageCount | Number of messages saved during the last minute of operation |
| com.firescope.sysloglistener:name=PersistedMessageCount | DailyMessageCount | Cumulative number of messages saved since midnight |
| com.firescope.sysloglistener:name=MessageExecutionTime | DurationMilliSeconds | Processing time in milli-seconds for the last received message |
| com.firescope.sysloglistener:name=DatabaseRefresher | ForceDatabaseRefresh | Force all queries to re-issue queries for the next message |
Accessing the FireScope managed beans can be accomplished via the following jmxclient invocations:
/java -Dhost=localhost -Dport=3306 -DbeanName=com.firescope.sysloglistener:name=ReceiveMessageCount -Dattribute=PerMinuteMessageCount -jar jmxdelegate.jar /java -Dhost=localhost -Dport=3306 -DbeanName=com.firescope.sysloglistener:name=ReceiveMessageCount -Dattribute=DailyMessageCount -jar jmxdelegate.jar /java -Dhost=localhost -Dport=3306 -DbeanName=com.firescope.sysloglistener:name=PersistedMessageCount -Dattribute=PerMinuteMessageCount -jar jmxdelegate.jar /java -Dhost=localhost -Dport=3306 -DbeanName=com.firescope.sysloglistener:name=PersistedMessageCount -Dattribute=DailyMessageCount -jar jmxdelegate.jar /java -Dhost=localhost -Dport=3306 -DbeanName=com.firescope.sysloglistener:name=MessageExecutionTime -Dattribute=DurationMilliSeconds -jar jmxdelegate.jar /java -Dhost=localhost -Dport=3306 -DbeanName=com.firescope.sysloglistener:name=DatabaseRefresher -Dattribute=ForceDatabaseRefresh -jar jmxdelegate.jar
Note: The managed beans listed above will not appear or be available until after the SyslogListener has received at least 1 message.
FireScope JMX Agent Configuration
The following list outlines prerequisites for enabling FireScope JMX monitoring on remote hosts:* A valid Java runtime (JRE) must be deployed and available on the remote host
- The jmxdelegate.jar file must be deployed and executable on the remote host.
- UserParameters must be defined and added to the agent configuration file on the remote host.
- The remote agent must be restarted
- It is recommended that the new UserParameter be tested on the remote host
For the purposes of this example we shall assume each of the following has been configured as described below:* A Java VM has already been configured for JMX access on port 4900
- A Java executable exists in the path
- The jmxdelegate.jar file has been deployed to /jars directory
- Our new user parameter shall be called “java.application.monitored.value�
- Our JMX bean name is called “application.MBean�
- The property of interest on this Mbean is called “property�
To configure our new user parameter we edit the agent configuration file by adding the following line:UserParameter=java.application.monitored.value,java -Dhost=localhost -Dport=4900 -DbeanName=application.MBean -Dattribute=property -jar /jars/jmxdelegate.jar
FireScope JMX Server Configuration
Create a Configuration Item (CI) that references the UserParameter that was created in the previous section. See Creating a Configuration Item.
JMX Enabling Your Own Java Applications
The code listed below describes the steps necessary to make your applications JMX capable. The process covered outlines only standard Mbeans. For more information regarding other typs of Mbeans such as MXBeans, or DynamicBeans refer to the following JMX API documentation or Java tutorial: http://java.sun.com/javase/6/docs/api/.
http://java.sun.com/javase/6/docs/technotes/guides/jmx/tutorial/tutorialTOC.html.
For any class that you wish to make available to JMX you must write an Mbean interface that lists the available JMX methods. The Mbean interface name must have the same prefix name as the implementing class.
public interface ExecutionMessageCounterMBean { public long getPerMinuteMessageCount(); public long getDailyMessageCount(); }
Then provide an implementation for the above interface such as the following:
package example:
import java.util.Calendar;
public class ExecutionMessageCounter implements ExecutionMessageCounterMBean
{
private int lastIndex;
private long[] perMinuteMessageCount;
public ExecutionMessageCounter()
{
super();
lastIndex = 0;
perMinuteMessageCount = new long[1440];
}
public long getPerMinuteMessageCount()
{
int perMinuteMessageCountIndex = getMinuteIndexNow();
return perMinuteMessageCount[perMinuteMessageCountIndex];
}
public long getDailyMessageCount()
{
long dailyMessageCount = 0;
for(long oneMinuteCount : perMinuteMessageCount)
{ dailyMessageCount += oneMinuteCount; }
return dailyMessageCount; }
private synchronized int getMinuteIndexNow()
{
Calendar calendar = Calendar.getInstance();
int resultIndex = calendar.get(Calendar.HOUR_OF_DAY) * 60 + calendar.get(Calendar.MINUTE); return resultIndex;
}
}
Now register your managed bean with the local Mbean server. Each bean must be registered using a unique name. For purposes of this example we shall use the domain of “example†and a name of “MessageCounter†as shown below:
ExecutioinMessageCounter counter = new ExecutionMessageCounter();
MBeanServer mBeanServer = ManagementFactory.getPlatformMBeanServer();
try { ObjectName objectName = new ObjectName(“example:name=MessageCounterâ€); mBeanServer.registerMBean(counter, objectName); }
catch(Exception exception)
{ // Add appropriate exception handling }
LDAP Check
Creating an LDAP Check attribute
Note: Before you can create LDAP Check attributes, you should define appropriate credentials to be used to execute the LDAP Queries.
Once you have working LDAP credentials attached to the CI, you can create the LDAP check attributes. Only attributes of CI’s associated to an LDAP credentials will be able to collect LDAP data.# Click on create button on the upper right hand corner of the Attribute page.Note: Make sure appropriate CI is selected.
- In the Data Collection Settings section select LDAP Check from the Type dropdown list.
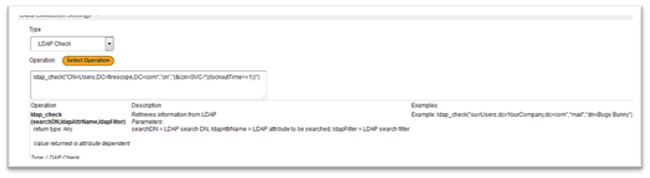
- Click on the Select Operation button and click on LDAP_Check. This will give you the syntax and examples for this attribute.
| Operation | Description | Example |
| (searchDN,ldapAttrName,ldapFilter)return type: CharacterType: LDAP CheckValue returned is attribute dependent | Retrieves information from LDAPParameters:searchDN = LDAP search DN, ldapAttrName = LDAP attribute to be searched, ldapFilter = LDAP search filter | Example: ldap_check(“ou=Users,dc=YourCompany,dc=com”,”mail”,” dn=Bugs Bunny”) |
- When defining the LDAP query ensure that you retrieve information which you can use as an attribute. For e.g. If you wanted to test if any account that begins “SVC-“ is locked out, you could write an LDAP query to simply return true or false, but it may well be more useful to write one which returns a list of those accounts which are locked out. This way, when you add this to a notification, the recipient knows which account(s) to investigate. As an example the following LDAP_Check attribute returns a list of accounts starting “SVC-“ which are currently locked out
ldap_check(“CN=Users,DC=firescope,DC=com”,”cn”,”(&(cn=SVC-*)(lockoutTime>=1))”) - Select appropriate data type returned from the query from Type of Information dropdown list. In the above example it would be character.
- Set the Update Interval.
- Click Save.
NetApp DFM Attribute
| Operation | Description | Examples |
| netapp_dfm_volume(volumeId, volumeKey)return type: CharacterType: NetApp DFM AttributeValue returned is stat dependent | Returns the latest volume stat value for the specified volumeId and volumeKeyParameters:volumeId = id of the volumevolumeKey = name of the stat | Example: netapp_dfm_volume(123,volume-size:afs-used)Returns the number of bytes used on volume 123 |
Netapp Check
| Operation | Description | Examples |
| netapp_capacity(algorithm)return type: Numeric (integer 64bit)Type: NetApp CheckValue returned in Bytes | Returns the latest filer capacity for the specified algorithmParameters:algorithm = The algorithm to be performed:totalRawCapacity, totalFormattedCapacity, totalSpareCapacity, totalCapacityInRaidSpace, totalCapacityInWaflReserve, totalCapacityInReservedSpace, totalCapacityForProvisioning, totalCapacityAllocated, totalCapacityOfUserUsableData, totalCapacityAvailable | Example:netapp_capacity(totalSpareCapacity) Returns the capacity of all spares on the filer. |
| netapp_disk(aggregateName, diskUid, diskKey)return type: CharacterType: NetApp CheckValue returned is stat dependent | Returns the latest disk stat value for the specified aggregateName, diskUidAnd diskKeyParameters:aggregateName = name of the aggregatediskUid = UID of the diskdiskKey = name of the stat | Example:netapp_disk(aggr0,5000CCA0:0996A808: 00000000:00000000:00000000:00000000: 00000000:00000000:00000000:00000000,rpm) Returns the rpm for the specified disk on aggr0 |
| netapp_perf(object, instance, counter)return type: CharacterType: NetApp CheckValue returned is counter dependent | Returns the latest counter value for the specified object and instanceParameters:object = the perf objectinstance = the perf instancecounter = the perf counter | Example:netapp_perf(system, system, http_ops) Returns number of http ops for system instance of the system object. |
| netapp_snapshot(volumeName, snapshotName, snapshotKey)return type: CharacterType: NetApp Check Value returned is snapshotKey dependent | Returns the latest snapshot stat value for the specified volumeName, snapshotNameAnd snapshotKeyParameters:volumeName = name of the volumesnapshotName = name of the snapshotsnapshotKey = name of the stat | Example: netapp_snapshot(vol0,hourly.0,total) Returns total snapshot space for hourly.0 on vol0 |
| netapp_snapshot_aggregate(volumeName, snapshotKey)return type: Numeric (integer 64bit)Type: NetApp CheckValue returned is Long | Returns the latest aggregate snapshot stat value for the specified volumeNameAnd snapshotKeyParameters:volumeName = name of the volumesnapshotKey = name of the stat | Example:netapp_snapshot_aggregate(vol0,total) Returns total aggregate snapshot space on vol0 |
| Value returned is Longnetapp_spare(diskUid, diskKey)return type: CharacterType: NetApp CheckValue returned is stat dependent | Returns the latest spare disk stat value for the specified diskUid and diskKeyParameters:diskUid = UID of the diskdiskKey = name of the stat | Example:netapp_spare(5000CCA0:0996A808: 00000000:00000000:00000000:00000000: 00000000:00000000: 00000000:00000000,rpm) Returns the rpm for the specified spare disk |
| netapp_volume(volumeName, volumeKey)return type: CharacterType: NetApp CheckValue returned is stat dependent | Returns the latest volume stat value for the specified volumeName and volumeKeyParameters:volumeName = name of the volumevolumeKey = name of the stat | Example:netapp_volume(vol0,size-used)Returns the number of bytes used on vol0 |
Percentile
| Operation | Description | Examples |
| percentile_attribute(operation,days_in_period,percentile)return type: Numeric (float)Percentile resultType: Percentile | Value of other attributes at specified percentile Parameters:Example: percentile_attribute (“netapp_volume(vol0,size-used)”,30,95) |
SMIS
| Operation | Description | Examples |
| smis_disk_metric(objectpath, property)return type:CharacterType: SMISValue returned is property dependent | Returns the current value of the specified SMIS metric Parameters:objectPath= SMI-S path to retrieve the Block Storage Statistical Data instance for the attributeproperty = The name of the property | Example: smis_disk_metric(10.83.26.34/root/emc: Symm_BlockStorageStatisticalData.InstanceID= ”SYMMETRIX-+-000198701245-+-Disk-+-0″,TotalIOs) Returns the toal number of IO operations for the specified instance |
| smis_system_metric(objectpath, property)return type: CharacterType: SMISValue returned is property dependent | Returns the current value of the specified SMIS metric Parameters:objectPath= SMI-S path to retrieve the Block Storage Statistical Data instance for the attributeproperty = The name of the property | Example: smis_system_metric(10.83.26.34/root/emc: Symm_BlockStorageStatisticalData.InstanceID= ”SYMMETRIX-+-000198701245-+-Array-+-0″,EMCTotalHitIOs) Returns the number of hit IO’s for the specified instance |
| smis_volume_metric(objectpath, property)return type:CharacterType: SMISValue returned is property dependent | Returns the current value of the specified SMIS metricParameters:objectPath= SMI-S path to retrieve the Block Storage Statistical Data instance for the attributeproperty = The name of the property | Example: smis_volume_metric(10.83.26.34/root/emc: Symm_BlockStorageStatisticalData.InstanceID= ”SYMMETRIX-+-000198701245-+-Volume-+-00000″,ReadIOs) Returns the total number of read IO’s for the specified instance |