Navigation and Dashboards II: Dashboards
General Information
Insights Dashboard
The Insights Dashboard provides a comprehensive overview of device management-related topics. It covers metrics on managed devices, deployments, and patch management information. Each widget offers a drill-down option to delve deeper into the data. Users can easily customise all dashboards to display more environment-specific data or new information. For more details on the capabilities of the dashboards, refer to the dedicated article.

Windows 10 and 11 versions and patch level deployment state

Mobile devices versions and patch level

Software deployments

Most widgets dynamically adjust based on the active filtering set in the filter panel

Available Widgets in Insights
| Dashboard | Description |
|---|---|
| Announcements | Displays the Announcements which are visible for the logged in user. In example, this can be used to inform colleagues on maintenance work or rollout activities. |
| Quick Starts | Links to important areas of the management console. |
| My Open Tasks | Displays the number of tasks assigned and open for the current user. |
| Managed Devices | Displays all computers in management. |
| Endpoint Devices (Active devices not seen last 7 days) | All devices which were not seen within the last 7 days. |
| Endpoint Devices (Active devices seen last 7 days) | All devices which were seen within the last 7 days. |
| Deployments last 7 days | Number of deployments last 7 days based on the deployment state information. |
| Failures last 7 days | Number of deployments with the result "Failure" last 7 days based on the deployment state information. |
| Pending Reboots | Displays how many installation states have the message "Reboot Pending". |
| Max # of Retries reached | Displays how many installation states have the message "Maximum number (x) of failed installation attempts reached." |
| Computers managed by Patch Management | Displays the number of all computers which have an patch management state reported. |
| Computers with Patches Missing, Approved and Assigned | Displays the number of all computers which reported patches that are missing, approved and assigned. |
| Computers with Missing and Assigned Security Patches | Displays the number of all computers with Missing and Assigned Security Patches. |
| Computers with Missing and not Assigned Security Patches | Displays the number of all computers with Missing and not Assigned Security Patches. |
| Patch scan date more than 7 days older than Inventory date | Displays the number of all computers with Patch scan date more than 7 days older than Inventory date. |
| Active Devices last seen | Displays the number of active computers in the time range on the Y-axis. |
| Windows 10 Devices Release Patch Level | Displays per Windows 10 release the number of computer with patch level as column. |
| Windows 11 Devices Release Patch Level | Displays per Windows 11 release the number of computer with patch level as column. |
| Android Devices Patch Level | Displays the number of Android device OS versions segmented by patch level. |
| iPad/iOS Devices OS updates | Displays the number of iPad/iOS devices by OS version. |
| Installations last 7 Days | Displays the packages with the most status updated within the past 7 days. |
| Errors last 7 days | Displys the packages with the most installation errors reported in the status of the last 7 days. |
Switching to classic dashboard
To switch to the classic "Home" dashboard use the "Switch to classic dashboard" action.

To switch back use the action "Try new dashboard"
Classic dashboard Home
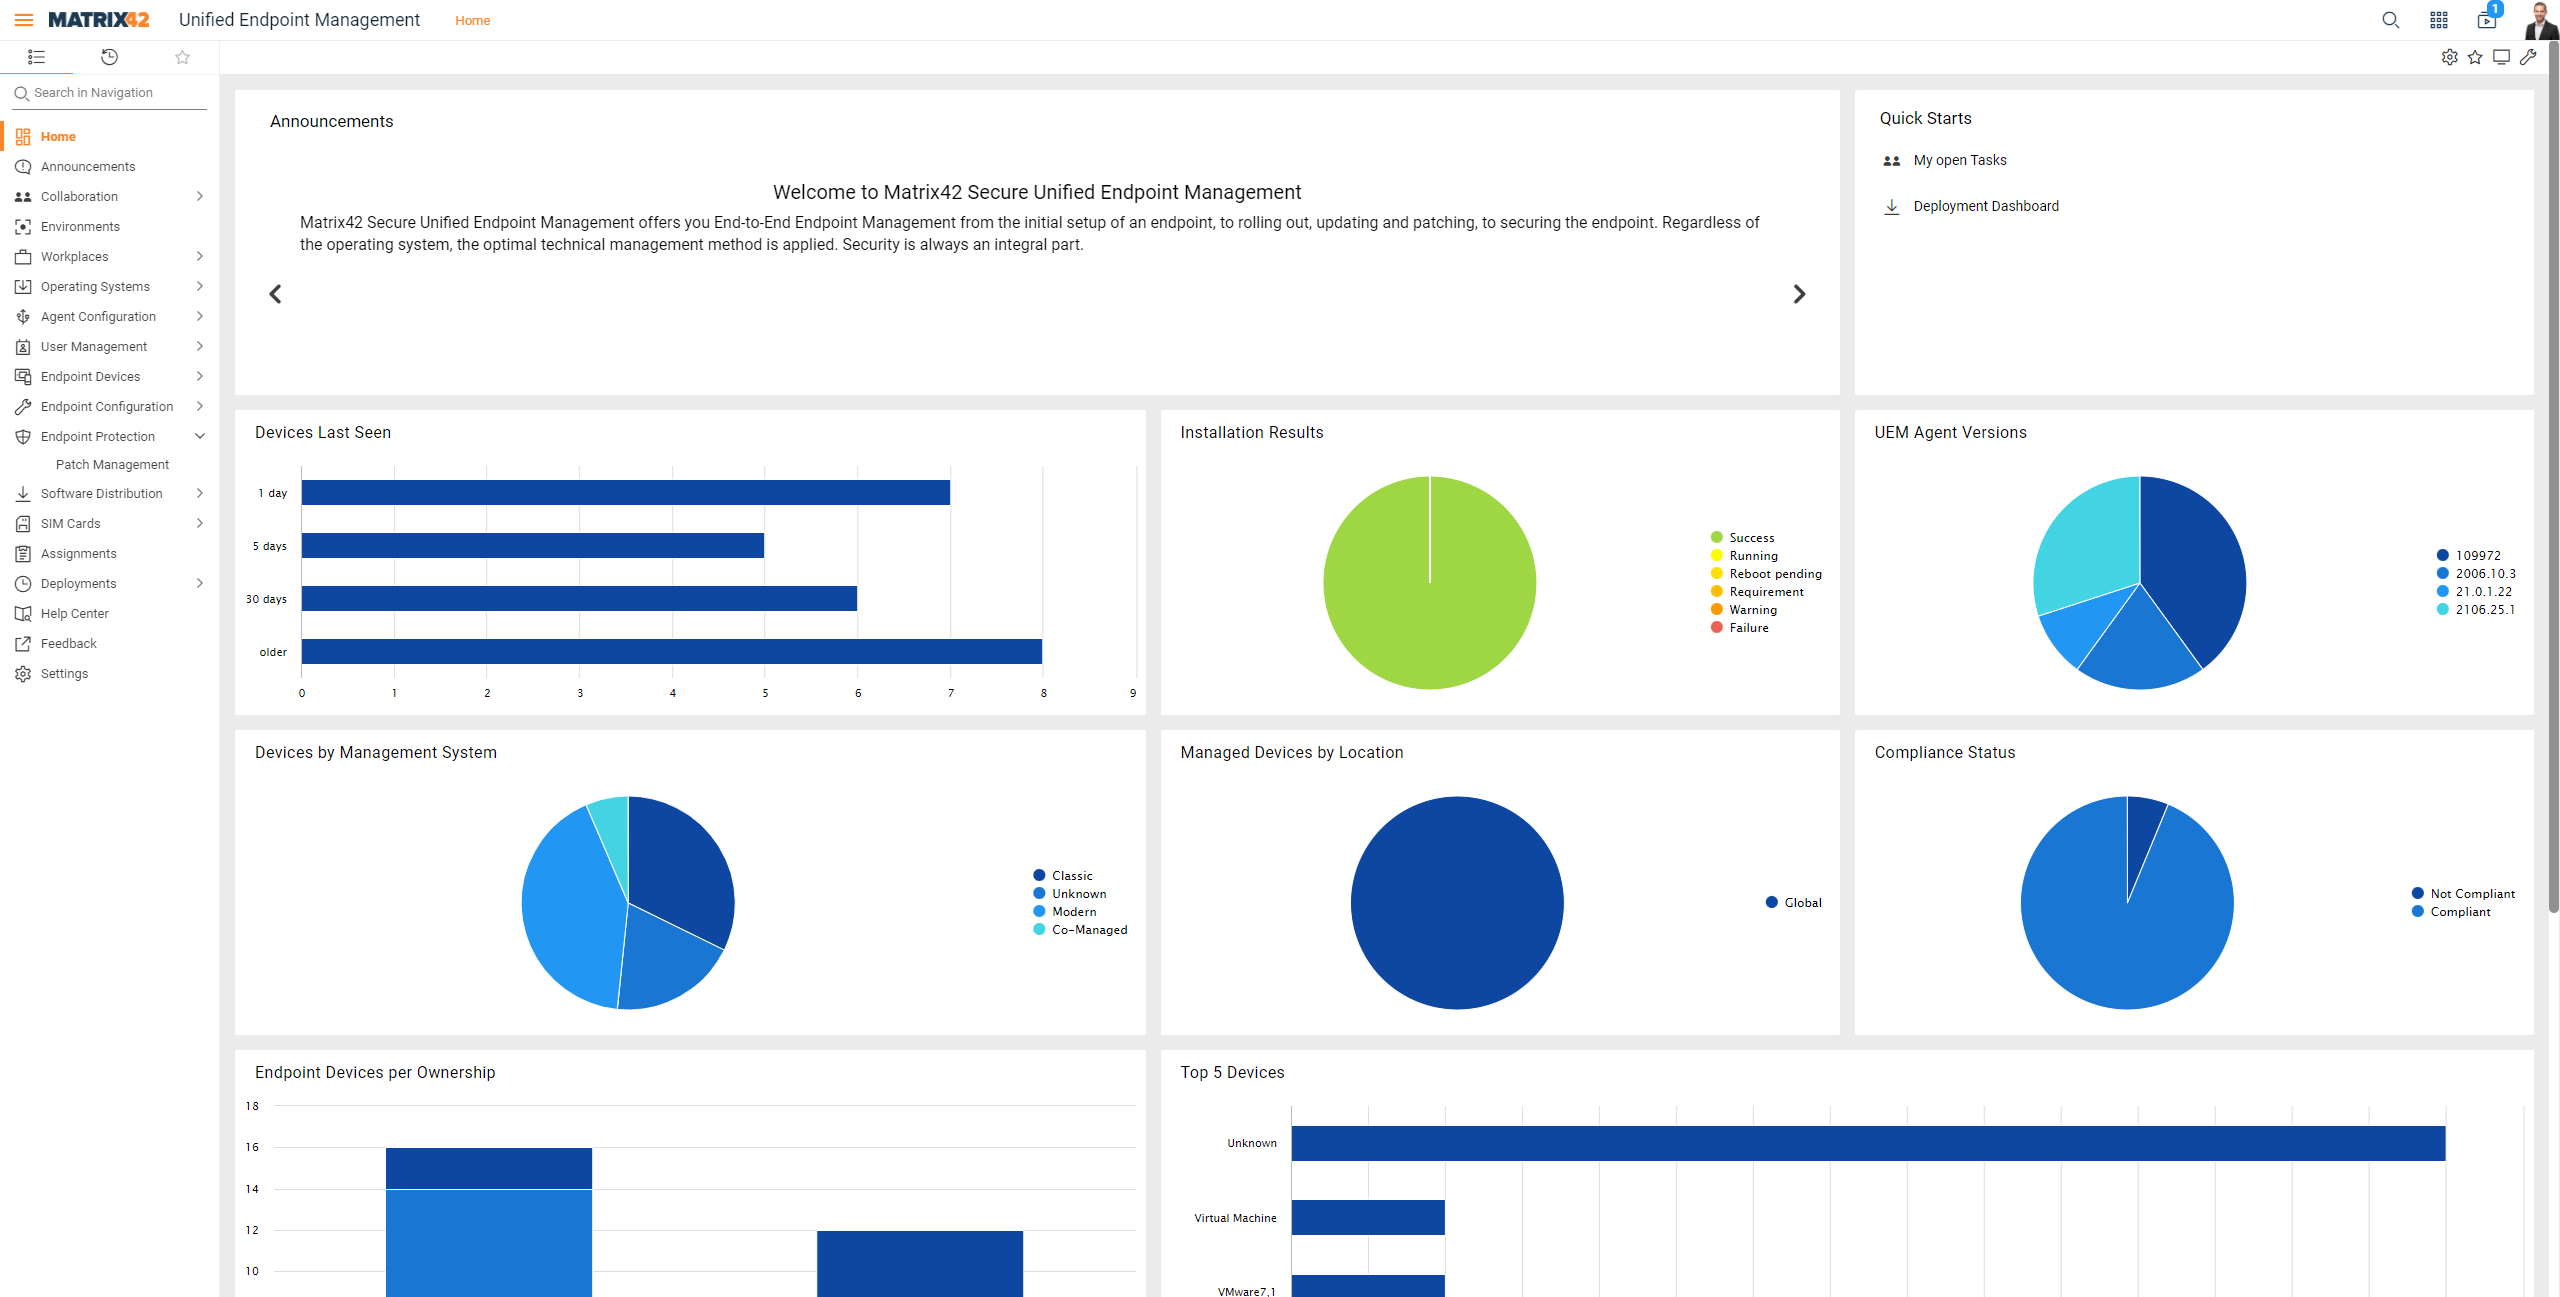
The Home navigation is part of the UUX for UEM console and displays the most important charts of device management information.

Clicking on one of the displayed field or bar opens a chart with further information. The help for the Actions you will find here.
Available Dashboards in Home
| Dashboard | Description |
|---|---|
| Announcements | Displays the Announcements which are visible for the logged in user. In example, this can be used to inform colleagues on maintenance work or rollout activities. |
| Quick Starts | Links to important areas of the management console. |
| Devices Last Seen | Displays the last time a device reported to the management system. This information depends on how this information was configured on the respective management system. |
| Installation Result |
Shows the information based on the installation status provided by Empirum and Silverback via Service Bus. Details can be reviewed on the Deployments navigation item. The following statuses are possible:
Reboot Pending, Requirement and similar messages of the UEM agent as well as the info text of the log information are transmitted additionally. |
| UEM Agent Version | Shows the distribution of the UEM Agent versions. Only system which report the UEM Agent version are counted. |
| Top 5 Devices | Here you will see the 5 most available models in the system. |
| Devices by Management System | Here you can see which management system is used. Classic (Empirum), Modern (Silverback) or Co-managed (both). |
| Managed Devices by location | This shows the location at which the device is managed. |
| Rollout Progress of active assignments (Last updated) |
It shows rollout progress for up to 5 activated Assignments with the most recent change date (last modified). Each assignment could have up to 3 different values:
|
| Assignment Status |
It shows current rollout state for all activated Assignments. It could have up to 4 segments:
|
| Devices by OS Plattform | Here you can see which operating systems are installed on how many devices. |