System Diagnostics and Server Logs
Overview
When something does not work, and you can't understand what, run the system health check and check log files.
The system Administrators can run the System Diagnostics and Download Server Logs from the Administration application homepage:

Administration Application Homepage: System Diagnostics and Download Server Logs Actions
System Diagnostics
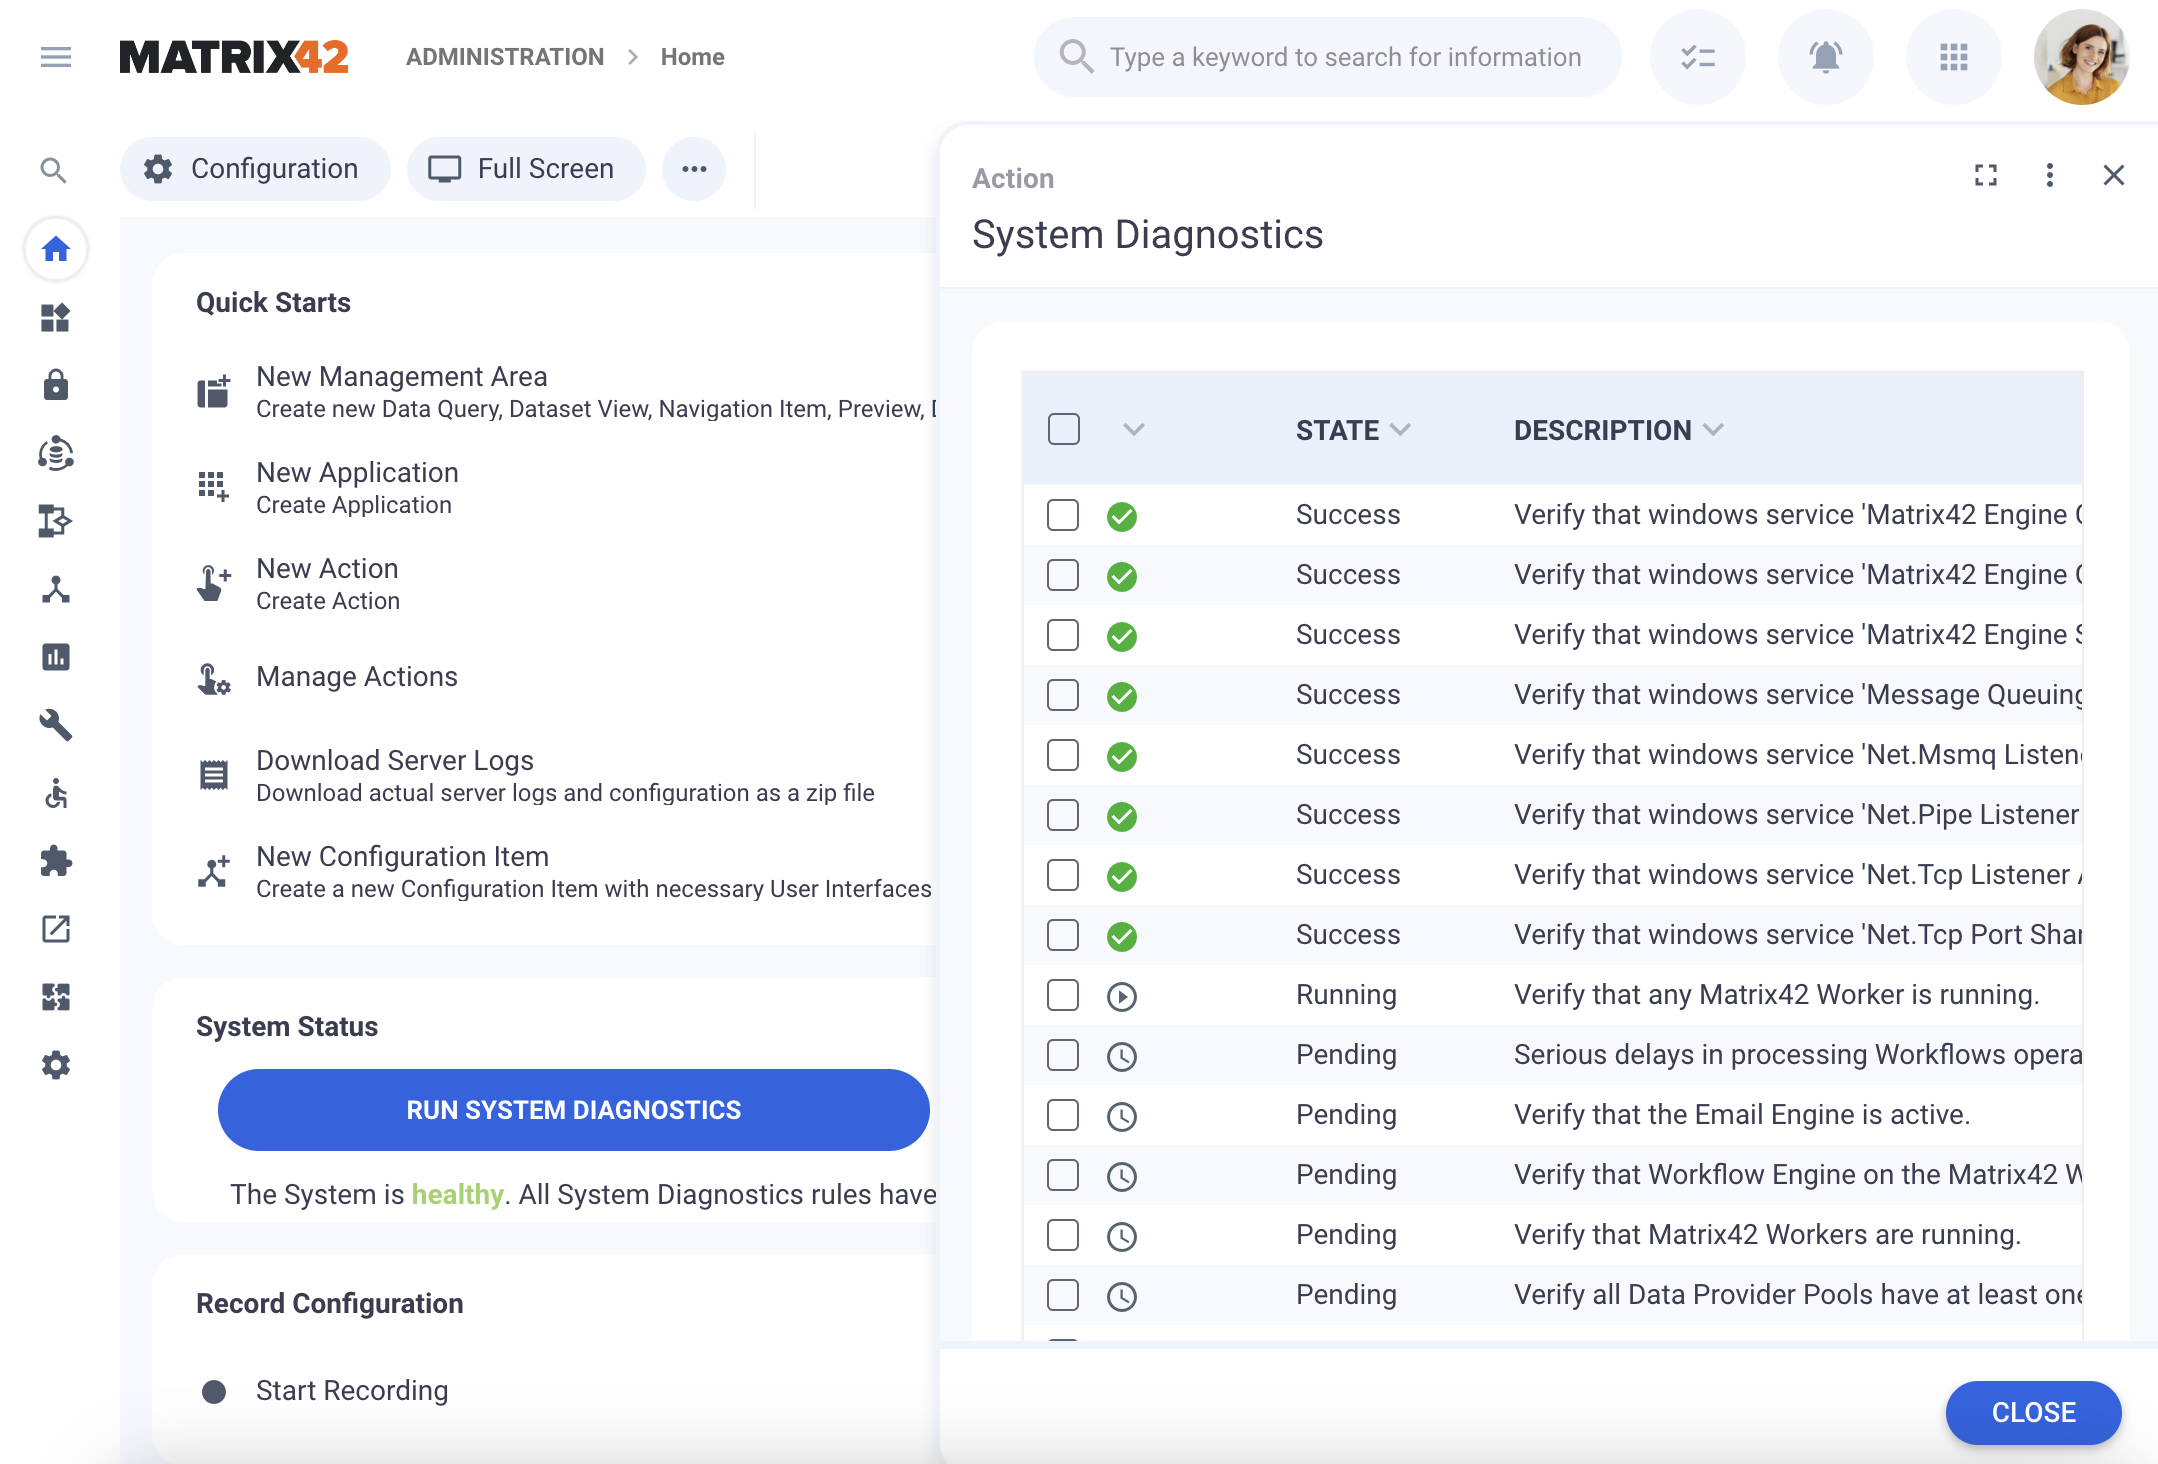
The "System Diagnostics" Action can be executed by Administrators from the Administration application → Home landing page by clicking on the corresponding button. A check for many system components will be executed, and in case the issue is present, this will be shown.
The following states are possible:
- Success: denotes that the checked item is running correctly and does not require any attention. No additional configuration is required to show the Success state
- Information: provides general insights into system behavior, such as successful operations, configuration changes, or routine status updates. Does not require any action when the message is shown
- Warning: highlights potential problems that may not immediately cause a failure but could lead to issues if not addressed. Examples include low disk space, high memory usage, or deprecated features.
- Error: indicates critical issues that prevent the system from functioning correctly. These require immediate attention, such as system failures, configuration issues, or service crashes.
We highly recommend fixing issues and having the System Diagnostics pass all the validation rules with Success to be sure the system is working correctly:
System Diagnostics: running the system health check progress example
In case of an error or warning, click on the checked item and scroll down to the Details section for more information:

Fix the issues and re-run the System Diagnostics.
Standard verified Items
System Diagnostics checks the following items and system components:
| # | Verified component | Comments & Useful Links |
|---|---|---|
| 1 | Verify that windows service 'Matrix42 Engine Common' is running | System Components: Windows Services |
| 2 | Verify that windows service 'Matrix42 Engine Scheduler' is running | System Components: Windows Services |
| 3 | Verify that windows service 'Matrix42 Data Gateway' is running | System Components: Windows Services |
| 4 | Verify that windows service 'Message Queuing' is running | Windows Services |
| 5 | Verify that windows service 'Net.Msmq Listener Adapter' is running | Windows Services |
| 6 | Verify that windows service 'Net.Pipe Listener Adapter' is running |
Windows Services This diagnostic rule is discontinued in ESMP v.12.1.2 |
| 7 | Verify that windows service 'Net.Tcp Listener Adapter' is running |
Windows Services This diagnostic rule is discontinued in ESMP v.12.1.2 |
| 8 | Verify that windows service 'Net.Tcp Port Sharing Service' is running |
Windows Services This diagnostic rule is discontinued in ESMP v.12.1.2 |
| 9 | Verify that any Matrix42 Worker is running | Matrix42 Worker Engine |
| 10 | Serious delays in processing Workflows operations | Matrix42 Worker Engine |
| 11 | Verify that the Email Engine is active | Email Engine and Designer |
| 12 | Verify that Workflow Engine on the Matrix42 Worker is running | Matrix42 Worker Engine: Matrix42 Workers & Workflows |
| 13 |
Verify that Matrix42 Workers are running. |
Matrix42 Worker Engine |
| 14 |
Verify all Data Provider Pools have at least one associated Matrix42 Worker. |
Creating a New Data Provider |
| 15 |
Verify released Workflows compatible with the Worker |
For warnings on this item, please consider adjusting the system as described on this page: Workflow Engine Migration Guide See also Manage Workflows: Runs on AppFabric |
| 16 | Verify connection to database 'Archive' | History Wizard |
| 17 | Verify connection to database 'Datawarehouse' | Data for license management reports |
| 18 | Verify connection to database 'Database File Storage' | |
| 19 | Verify that windows service 'Web Deployment Agent Service' is running | Windows Services |
| 20 | Verify connection to database 'Worker Workflow Monitoring' | Workflow Instances Activity Monitoring |
| 21 | Verify connection to database 'Workflow Persistence' | Workflow Engine: Persistence |
| 22 | Verify Workflow activations | Workflows: Publish action |
| 23 | Verify Workflow Engine to start workflow synchronously |
This diagnostic rule is discontinued in ESMP v.12.1.2 |
| 24 | Verify Workflow Engine to start workflow asynchronously | Workflow Engine |
| 25 | Verify Workflow Instance running on Matrix42 Worker | Workflow Instances Activity Monitoring: Runs on AppFabric |
| 26 | Verify that present Workflow Instances are valid | Workflow Instances Activity Monitoring |
| 27 | Verify connectors configurations | Connectors Overview: Connectors Delivered with Matrix42 products |
| 28 | Service Connections validation | Service Connections |
| 29 | Validating display expressions | |
| 30 | Validating dynamic structures | |
| 31 | Validating GDIE rules | Generic Data Import Export |
| 32 |
Validate Consistency of Import Definition Filtering Configurations |
Identifies Import Definitions that use deprecated source data filtering method. Adjusting Import Definitions to Replace Deprecated Source Filtering Method |
| 33 |
Validate that layout source/control filters are secured |
|
| 34 | Validating grid layouts | Grid Controls |
| 35 | Validating quick filters | Quick Filters |
| 36 | Validating structures | Navigation Items: Structures |
| 37 |
Validate Object Links and Object Pickers Data Query Column expressions |
Shows the widget name and the control type where the column in the Data Query Column to Display should be reviewed and reconfigured, otherwise, it can not be properly displayed. |
| 38 |
Verify Data Query Column Expressions |
Data Query |
| 39 |
Verify the Web Application correctly initialized. |
|
| 40 |
Verify the connection with the Licensing Server is established |
License Certificates |
| 41 |
Ensure Product License Compliance |
License Certificates |
| 42 | Verify the license certificates integrity |
There are corrupted license(s). You need to delete them to avoid system malfunction. License certificate file names are enumerated in the message details |
| 43 |
Verify that license certificates have not reached their expiration date |
There are expired license certificate(s) found. Please get in touch with Matrix42 to renew your license certificate(s). The list of expired licenses is provided in the message as well. |
| 44 |
Verify that license certificates are not approaching their expiration date |
|
| 45 |
Verify that the number of Managed Users or Assets in use has not exceeded the licensed limit |
There are license certificate(s) with over usage. Please get in touch with Matrix42 to obtain more license certificate(s). The list of affected licenses is provided in the message as well. Some certificates might be issued with an incorrect number of users/assets and therefore display that the license has a usage limit of 0 or 1, while the license certificate is valid and actually contains the correct purchased number. Get in touch with Matrix42 to get the updated license certificate. |
| 46 |
Verify that the number of Managed Users or Assets in use is not approaching the licensed limit |
There are # license certificates number of Managed Users or Assets approaching the licensed limit. The list of affected licenses is provided in the message as well. The message is shown when more than 95% of active users are achieved. |
| 47 |
Verify that license certificates are not duplicated |
Multiple license certificates have been found for a specific product. This may be due to unused or outdated licenses. The list of unused licenses is provided in the message as well. |
| 48 |
Verify that Manager property can be imported with the filtering configured in the Entra ID provider. |
Microsoft Entra ID Data Provider: Import Manager |
| 49 | Verify Push Notification events | Push Notifications |
| 50 | Verify that reports are accessible. | Verifies accessibility to the SSRS Reports Server. |
| 51 | Verify report generation limit for the next days |
Starting with ESMP v.12.1.3, verifies whether the report and dashboard email generation for subscriptions exceeds the system-defined limits. |
| 52 | Verify browser for report generation |
User-Defined Diagnostics Rules
User-defined Diagnostics Rules are custom-created rules that are created through the user interface and run during the standard System Diagnostics check.
Diagnostics Rules are introduced in Enterprise Service Management Platform v.12.1.2.
User-defined Diagnostics Rules can be added as objects to the Configuration Project and later run as a part of the installed Extension.
User-defined Diagnostics Rules are located in the Administration application → Services & Processes → Diagnostics Rules page. The page lists all custom system diagnostics rules. The standard system diagnostics rules that are a part of the product are not listed here.

Add System Diagnostics Rule
To add a new custom diagnostic rule, click Add System Diagnostics Rule action and fill out the following fields:

- Title: the name of the rule that will be shown in the description column when the System Diagnostics is run

- Disabled: checkbox options
- Not selected (default): the created rule is run during the system diagnostics
- Selected: the rule is saved in the system but not activated and is not run during the system diagnostics
- Comments: comment for the diagnostic rule that will be shown in the details section in case the diagnostic rule result is an Information message

- Implementation Script: write a PowerShell script that checks the necessary component and includes logic for Information, Error, and Warning check results.
Implementation Script Example: state result
The Diagnostics Rule check can have the following results:
| State result | Configuration | Message Details |
|---|---|---|
| Success | not configured | no message is shown |
| Information | Information, Warning, and Error message details should be declared in the Implementation Script field of the Diagnostic Rule configuration. |
Diagnostics result shows the state and corresponding message in the details section of the System Diagnostics result. For the Information message, the data from the Comments field is appended to the Information output result from the PowerShell script. |
| Warning | ||
| Error |
The following PowerShell script checks the free disk space in the system drives and includes the examples of the the output messages that are shown in case the diagnostics rule results in Error, Warning, and Information message details:
# Check free disk space on all filesystem drives
$drives = Get-PSDrive -PSProvider FileSystem

foreach ($drive in $drives) {
    # Convert free space from bytes to gigabytes
    $freeGB = $drive.Free / 1GB
    $roundedFree = [math]::Round($freeGB, 2)

    # Output message details for the diagnostics result with Error state:
    if ($freeGB -lt 1) {
        Write-Error "Drive $($drive.Name): CRITICAL low disk space - only $roundedFree GB free!"
    }

    # Output message details for the diagnostics result with Warning state:
    elseif ($freeGB -lt 10) {
        Write-Warning "Drive $($drive.Name): Warning - low disk space - $roundedFree GB free."
    }

    # Output message details for the diagnostics result with Information state:
    else {
        Write-Output "Drive $($drive.Name): Sufficient disk space - $roundedFree GB free."
    }
}
Implementation Script Example: reading data from the Data Layer
In the PowerShell script use the global PowerShell variables which provide easy access to the system's Data Layer, Service Connections, Logs, and WebApiClient components.
For more details on available global variables capabilities, see Private SDK API.
The following PowerShell script reads data from the DWPSystemDiagnosticRuleClassBase Data Definition from the Data Layer:
#Read data from Data Layer
$dbData = $M42_DatabaseProvider.GetData("DWPSystemDiagnosticRuleClassBase", "ID,Title,ImplementationScript,Order,Comments", "Disabled=0",$null)

# Output message details for the diagnostics result with Warning state:
if ($dbData -eq $null) {
    Write-Warning "GetData returned null. Ensure the query is correct and the database contains the expected data."
} elseif ($dbData -is [System.Data.DataTable]) {
    $M42_Log.Info("Amount of active Scripted Diagnostic Rules: {0}", $dbData.Rows.Count)
    if ($dbData.Rows.Count -eq 0) {
        Write-Warning "GetData returned a DataTable, but it contains no rows."
    } else {
        echo "DataTable rows:"
        foreach ($row in $dbData.Rows) {
            echo "ID: $($row['ID']), Title: $($row['Title']), Script: $($row['ImplementationScript']), Order: $($row['Order']), Comments: $($row['Comments'])"
        }
    }
} else {

  # Output message details for the diagnostics result with Error state:
    Write-Error "Unexpected return type from GetData: $($dbData.GetType().FullName)"
}
When the Implementation Script is completed, click Save&Close to proceed.
All created rules that are listed in the Diagnostics Rules area are added to the standard System Diagnostics check and will be run with the next system check unless the rule is marked as Disabled. Custom rules are added to the end of the list after the standard system rules.
Run the System Diagnostics from the homepage of the Administration application to see the created Diagnostics Rule:

In the case of the Success rule check result, no message is shown.
System Status: Run System Diagnostics
The System Status dashboard is shown on the Administration home page.
System Status is run automatically when the home page of the Administration application is opened for the first time and is automatically refreshed every 3 hours after the last automatic check:

System Diagnostics Result dashboard: automatically running the System Diagnostics
Click on the Run System Diagnostics action to update the System Status dashboard manually.
The dashboard shows when the last check has been run and a summary of the found issues of the following types:
- Error
- Warning
- Information

For more details on the found issues, click on the checked item:

Download system logs
It is possible to download logs from the application, without directly accessing the Application Server. This can be done by clicking on the Administration application → Home → Download Server Logs button:

All Server Logs are downloaded locally to your device in a .zip archive.
You can also check specific logs from the Application Server. As a rule, in the default setup log files are located in C:\Program Files\Matrix42\Matrix42 Workspace Management\Logs\ directory.
For more information on the log file types, see also System Components: Web Application section of the page.