Workflows Health Check
Overview
Workflows Health Check is a Landing Page that provides the most important information and visualized statistics of the recently ran workflows and their processing by the Workflow Engine.
The Health Check page is located in Administration application → Services & Processes → Workflows.
Workflow Engine
The data on the Workflows page depends on the Workflow Engine that is currently used in the system.
AppFabric
By default, the AppFabric or legacy Workflow Engine is applied. In this case, the Workflows Health Check page shows the following information:
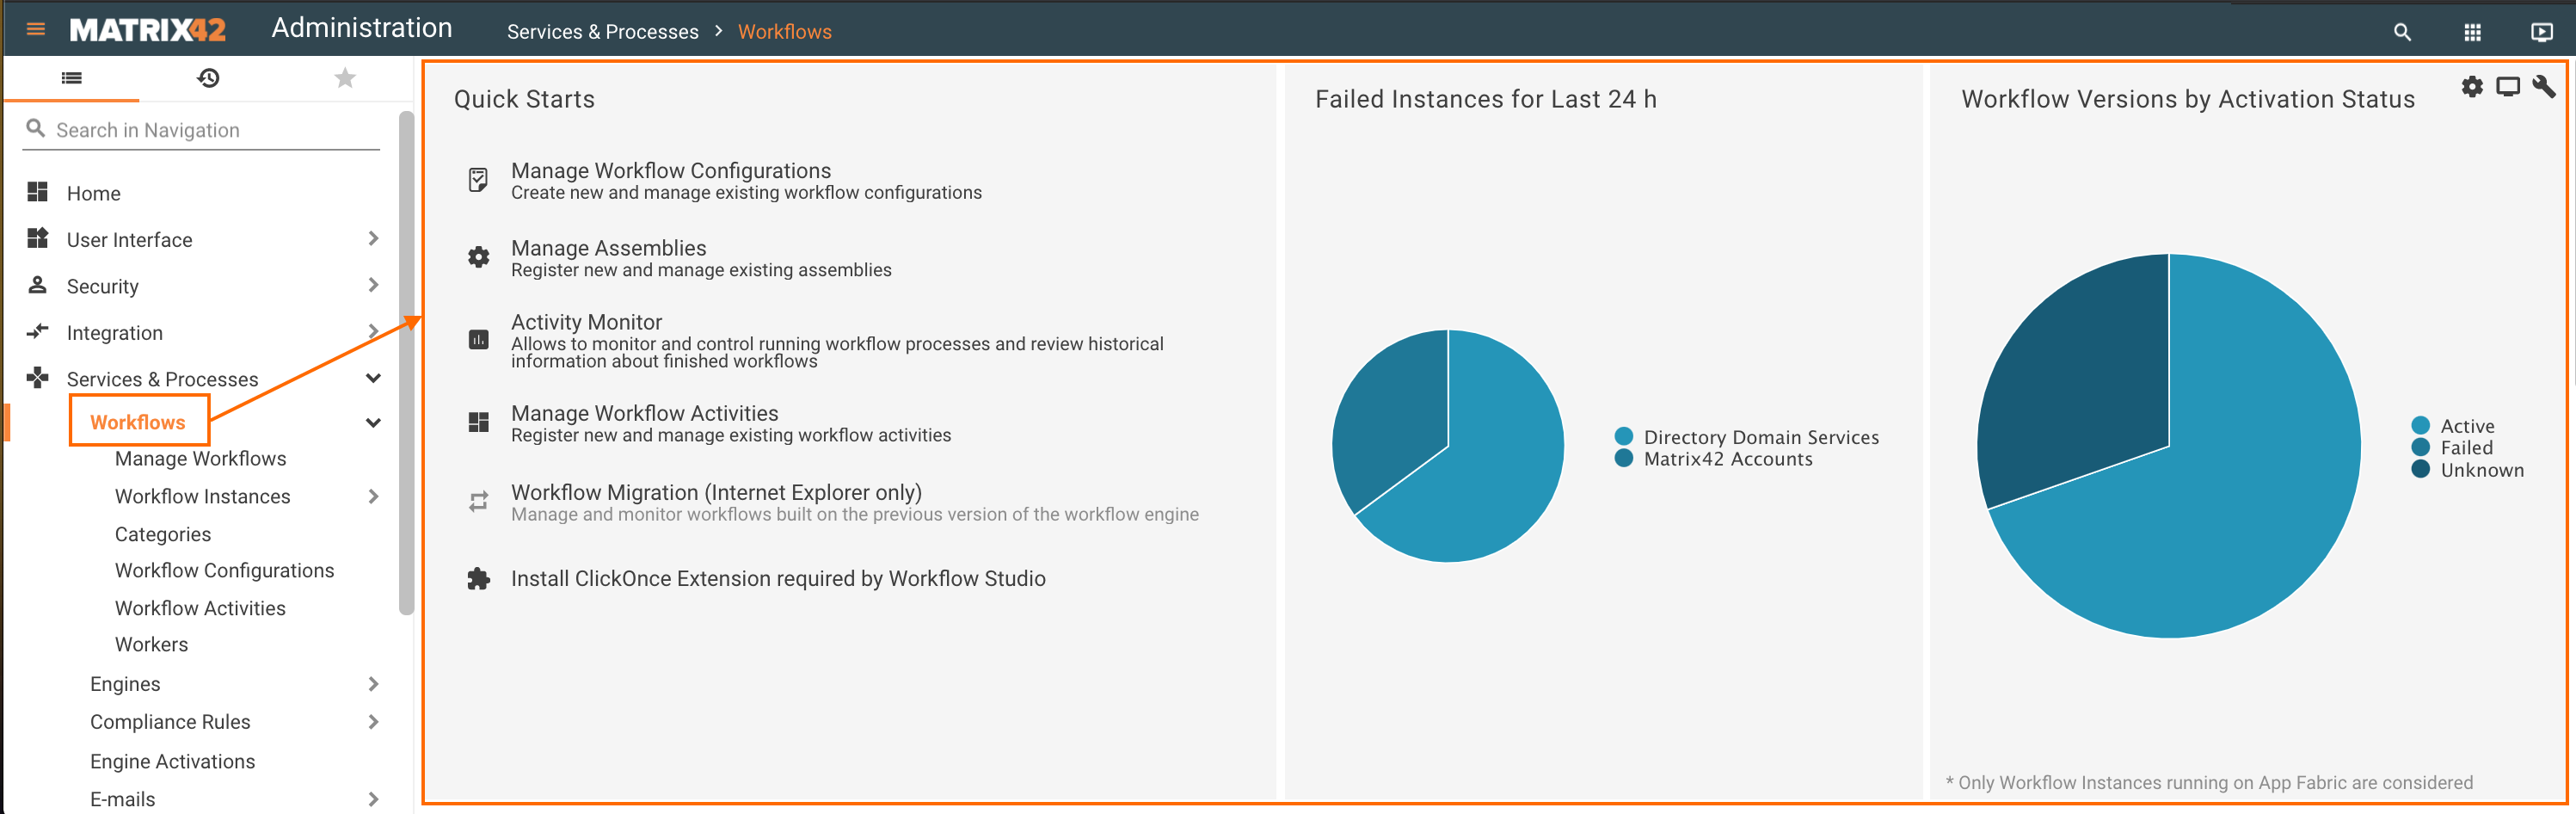
- Quick Starts links
- Failed workflow instances for Last 24 hours
- Workflow versions by Activation Status
Matrix42 Workers
The detailed statistic is available for the system that is running in the hybrid mode (AppFabric and Worker) or completely on the Matrix42 Workers.
The Workflow Engine settings are managed in Administration application → Settings → edit Global System Settings → Workflows section.
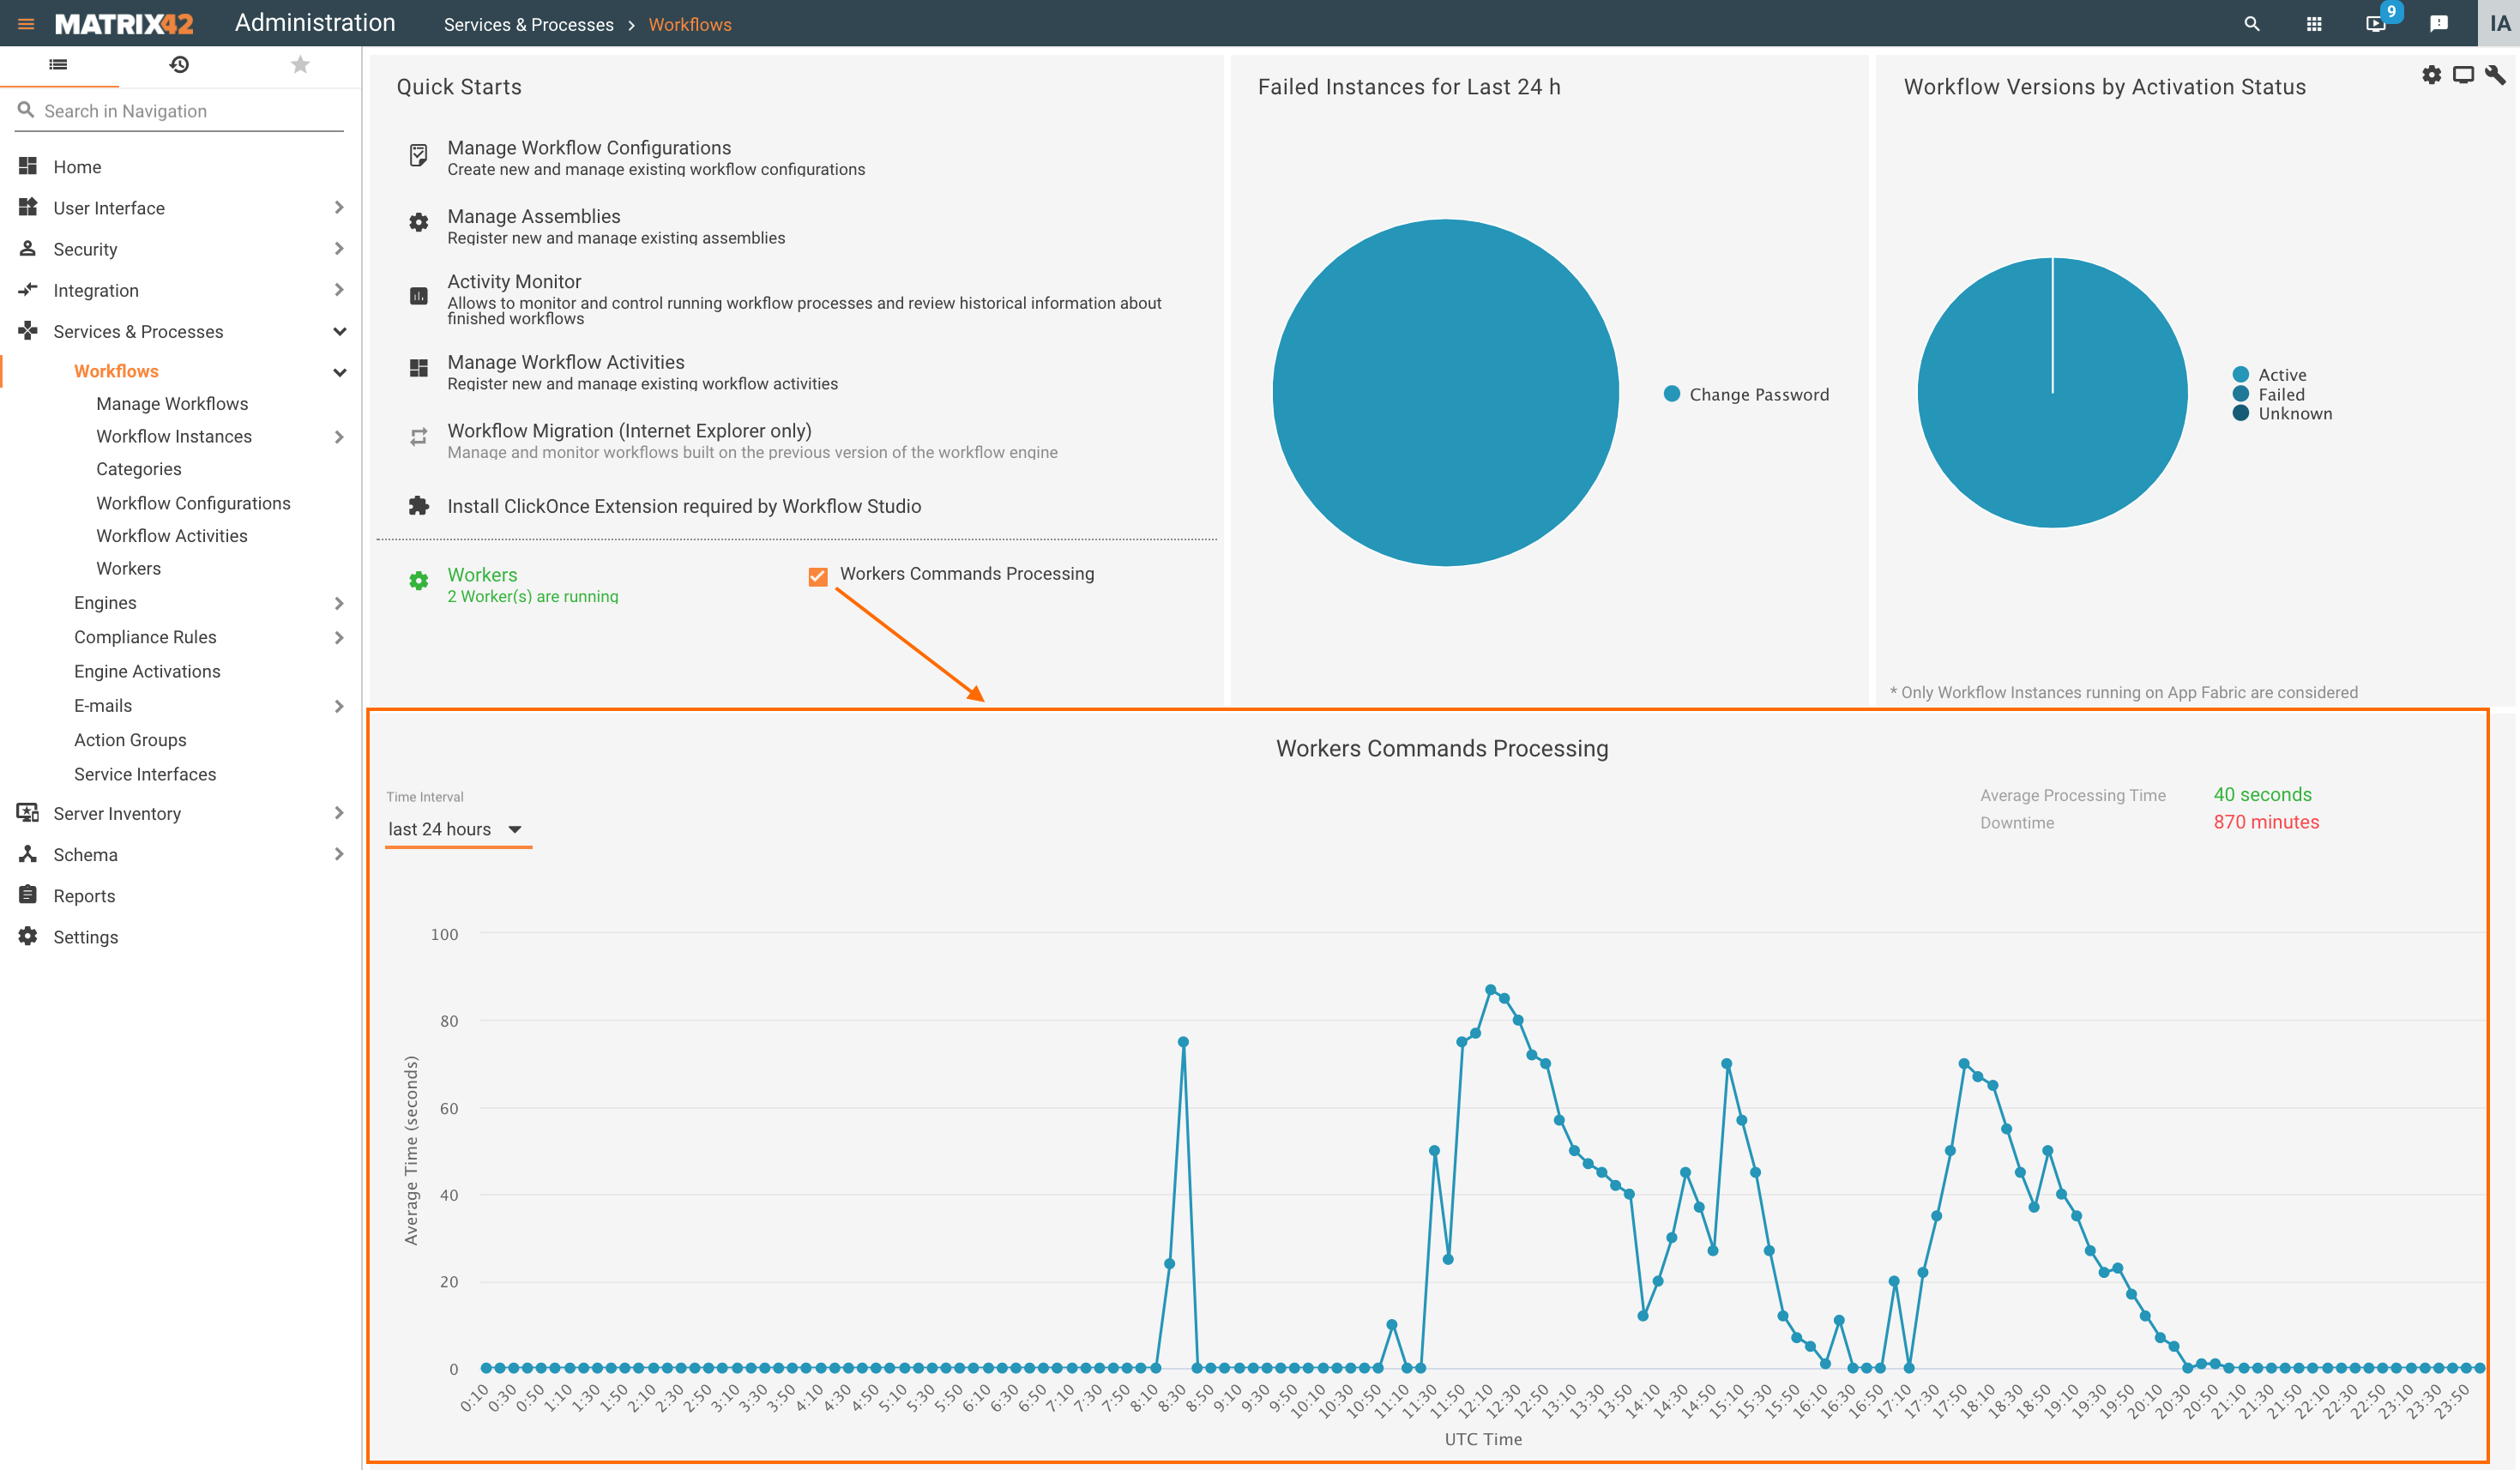
When the workflows are processed by the Worker, the Workflows Health Check page additionally:
- shows running Workers;
- monitors the Workers Commands Processing and retrieves this data to the chart.
By default, the detailed statistic is not shown.
Workers Commands Processing Chart
Select the Workers Commands Processing check-box to see the chart:
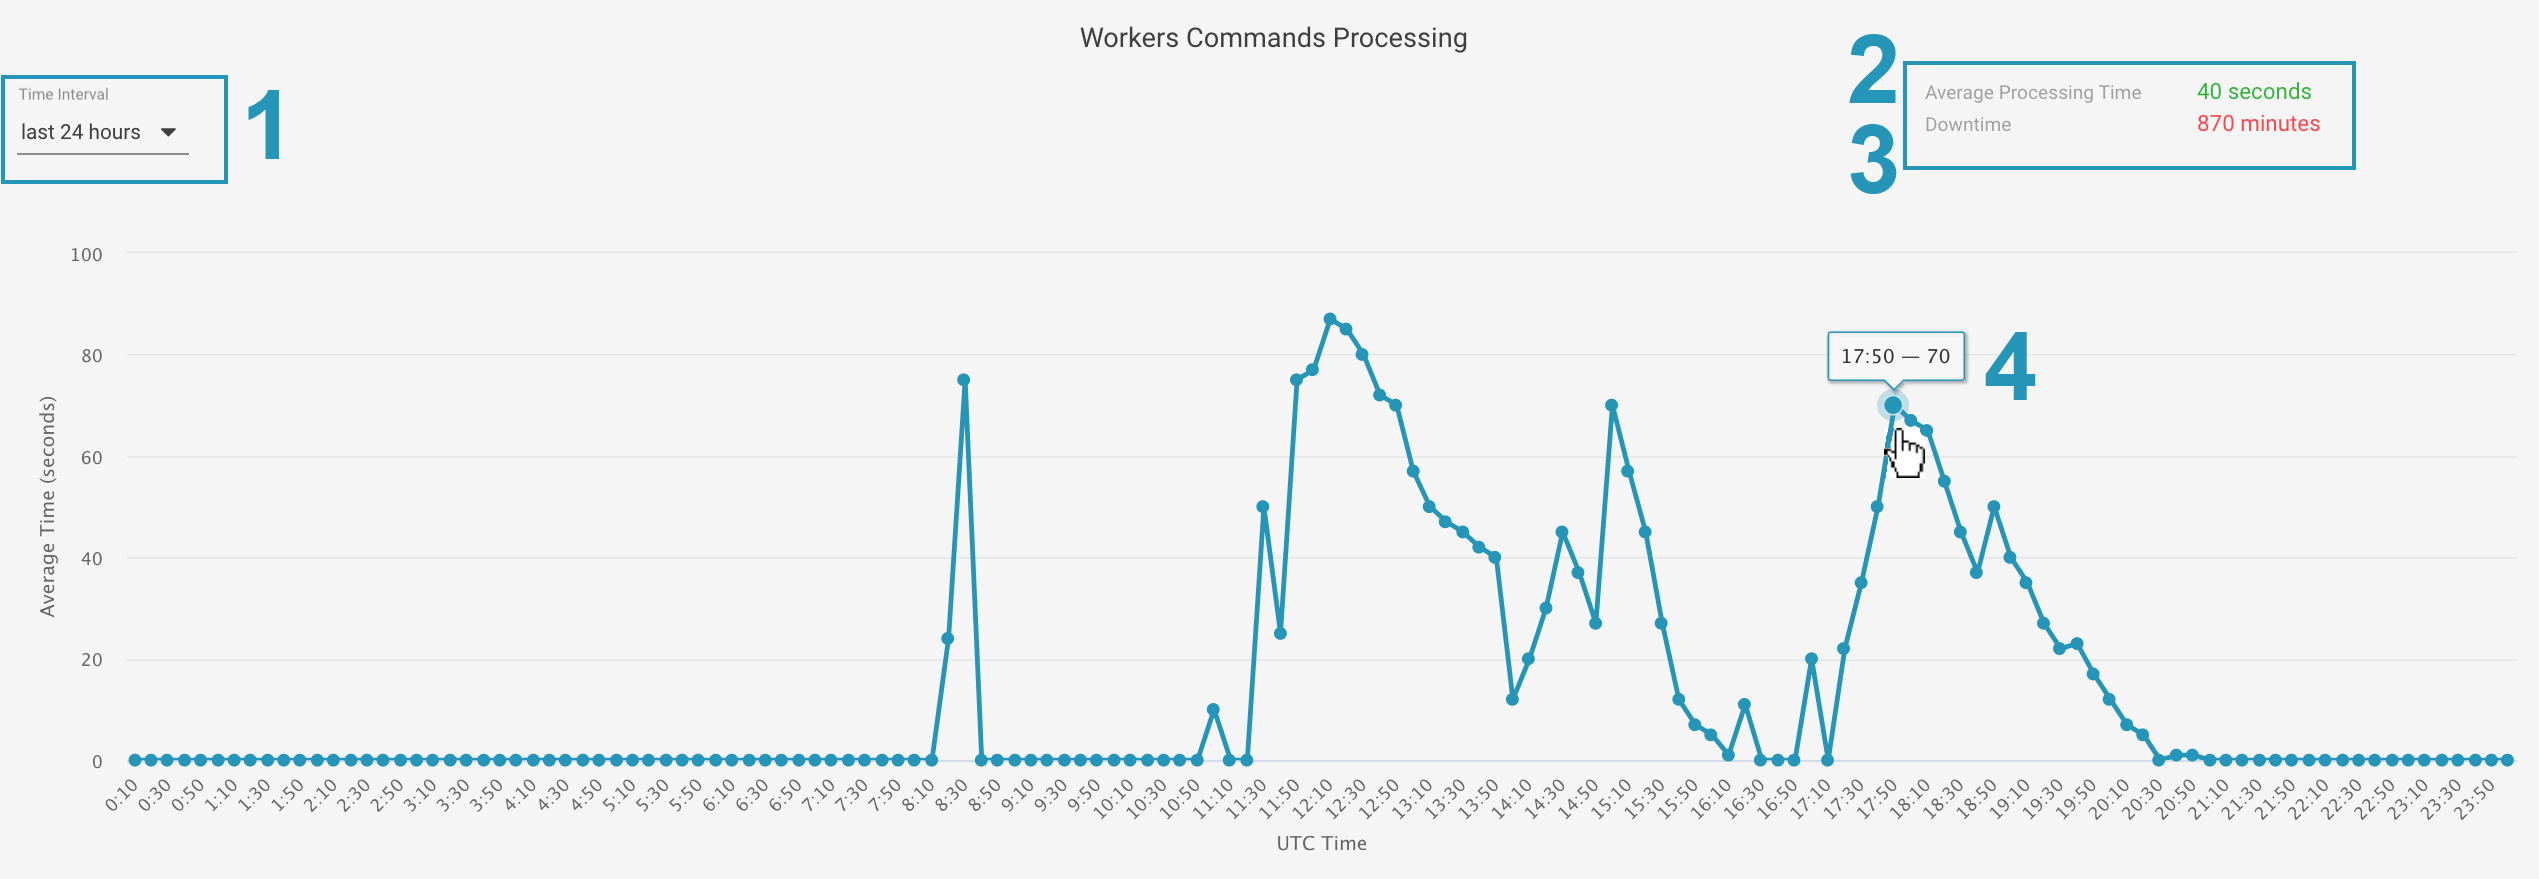
The Workers Commands Processing chart shows the following information:
- Time Interval: choose the time period to analyze the statistic. Available options:
- last 6 hours
- last 12 hours
- last 24 hours
All statistics and chart data depend on the selected time interval.
- Average Processing Time: average processing time of the task or how long the task remained in the queue until the Worker had processed the task. The displayed value is calculated for the chosen Time Interval.
- Downtime: the maximum time in minutes when the Worker was not available (worker was not running, was shut down or not available due to other technical reasons) during the selected time interval.
For instance, during the last 24 hours, the Worker downtime had several time intervals: 10 minutes, 60 minutes and 870. The Downtime statistic is not summed up and includes the maximum period of 870 minutes.
The downtime is not shown in the chart and is calculated automatically based on the missing statistic, as when the worker is not available, the statistic is not recorded as well. When the Worker is in the Idle state the statistic is recorded. - Average Time (seconds): average processing of the task or how long the task remained in the queue until the Worker had processed the task. The average time is calculated for the 10-minute increment.
The Worker statistic is updated every minute and the chart displays data averages in 10-minute increments.
The chart shows data for UTC time.
Troubleshooting
Scaling Matrix42 Workers
When the worker is loaded to capacity the warning message suggests running an additional worker. The maximum capacity is reached when the Average Processing Time is more than 5 minutes:
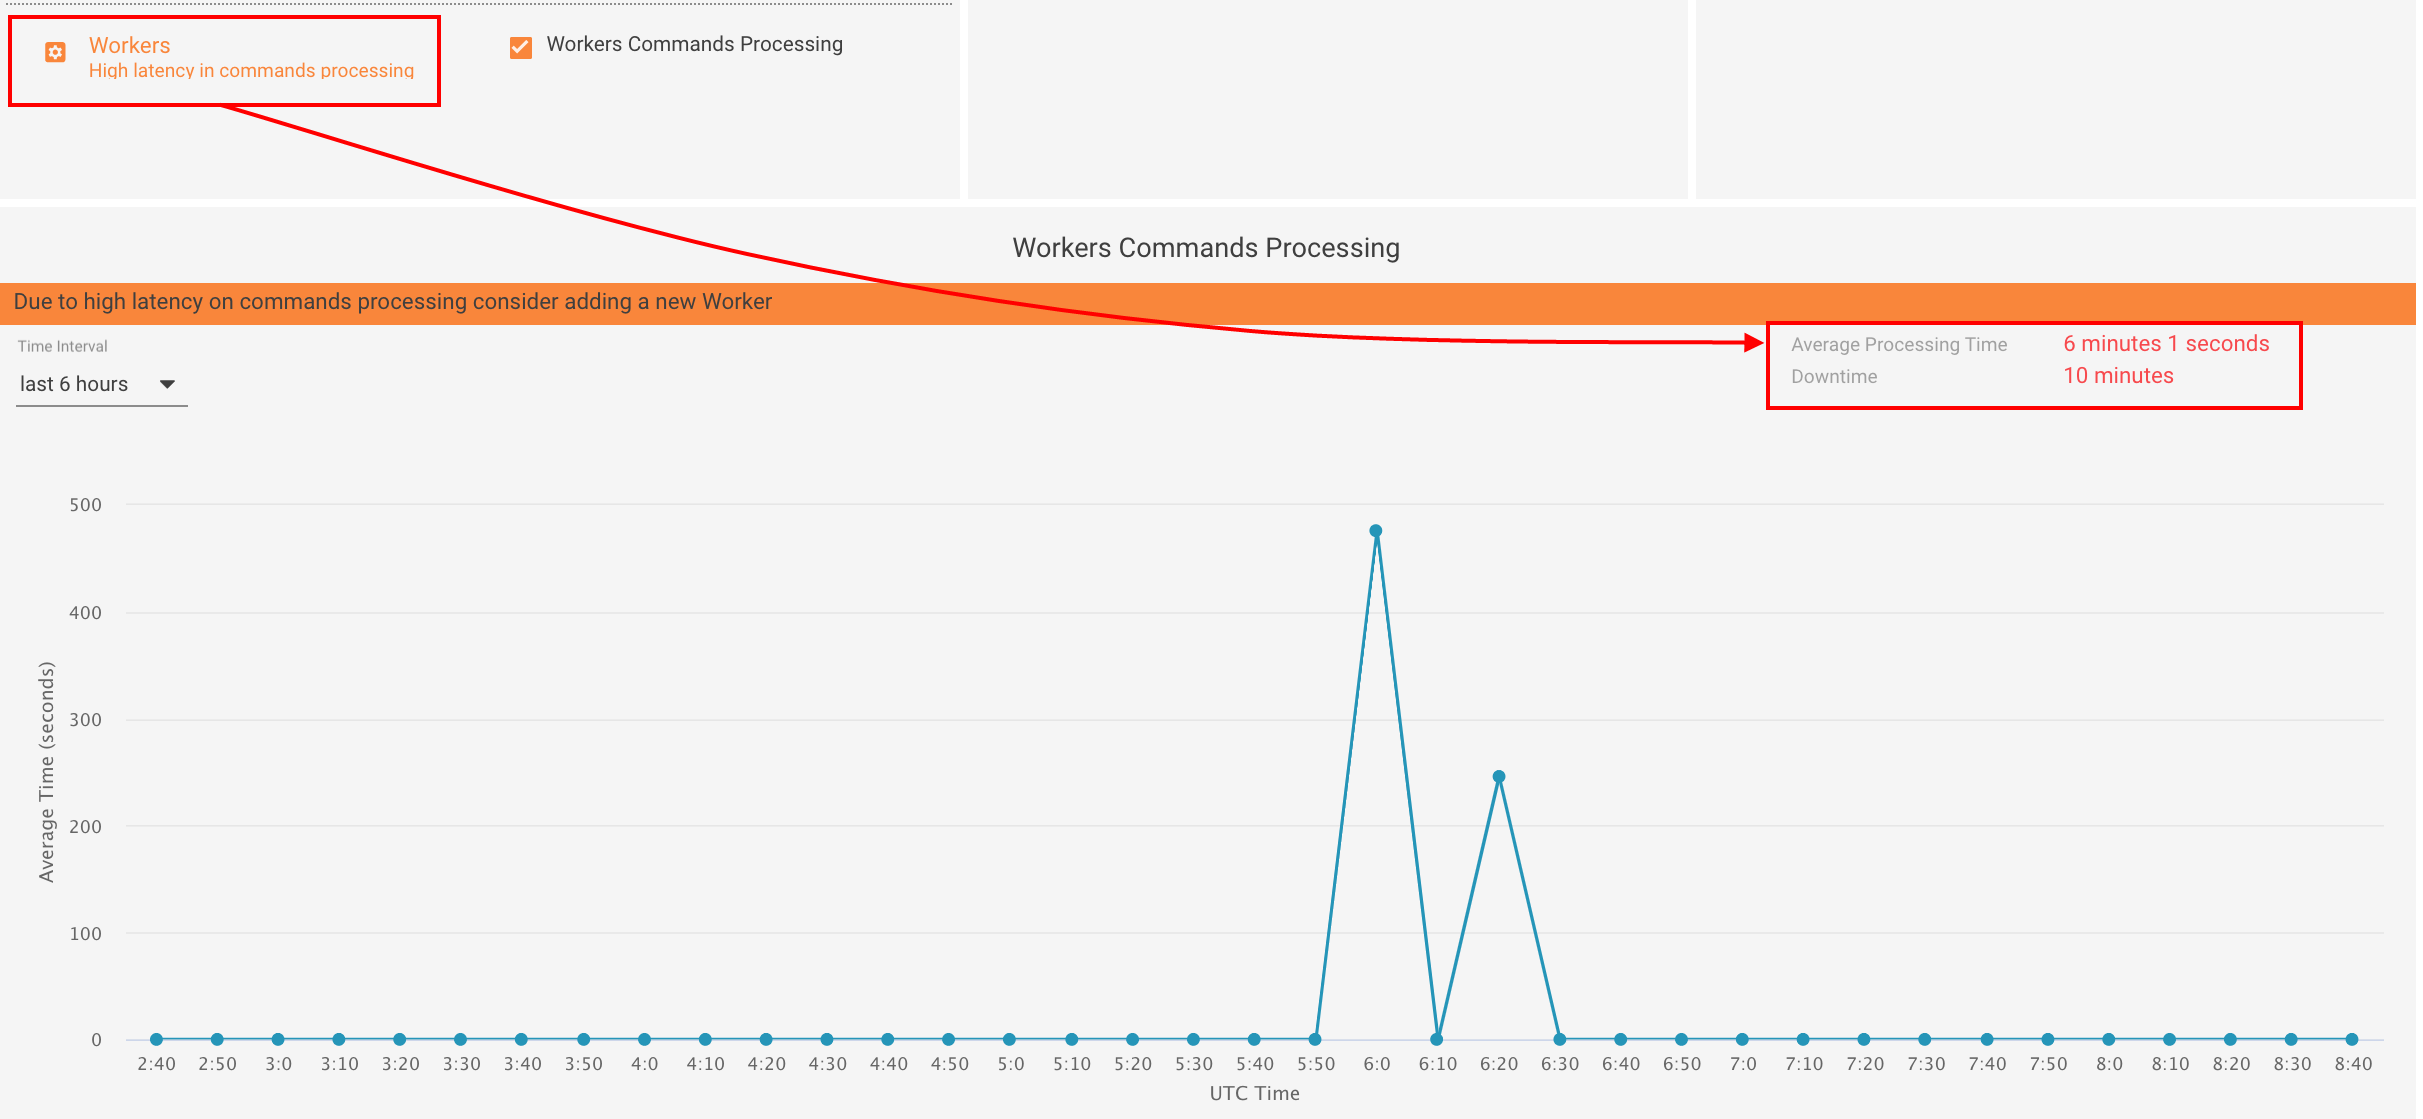
To reduce the task processing time run an additional Matrix42 Worker as described on the Workflow Engine page.
The scaled workers clear the Queued Workflow Instances faster as can be seen from the grouped by state instances:
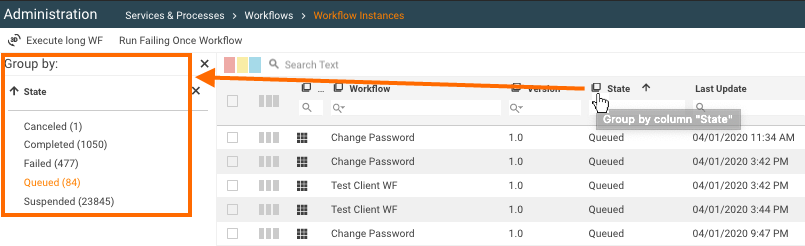
Over time this data is reflected on the Workers Commands Processing chart.
Downtime Commands Processing
The workflow instances that had Failed due to the downtime (worker was not running, was shut down or not available due to other technical reasons except for the maintenance mode) can be Reanimated manually as described on the Workflow Instances Activity Monitoring page.