Performance Analysis Report
Overview
Performance Analysis report allows the system Administrators to assess the environment's performance and bottlenecks based on the key indices and data of the used Databases, Resource Consumption, and SQL queries statistics. It simplifies performance troubleshooting by helping you quickly find performance differences that are tracked over time and shown according to the specified in the report time intervals.
By default, the Performance Analysis report displays data for the last 7 days.
Performance Analysis report is available for the systems using SQL Server 2016 and higher having Query Store feature enabled.
The report consists of 3 pages with the following information:
- Performance Analysis
- History Database
- SQL Queries Analysis
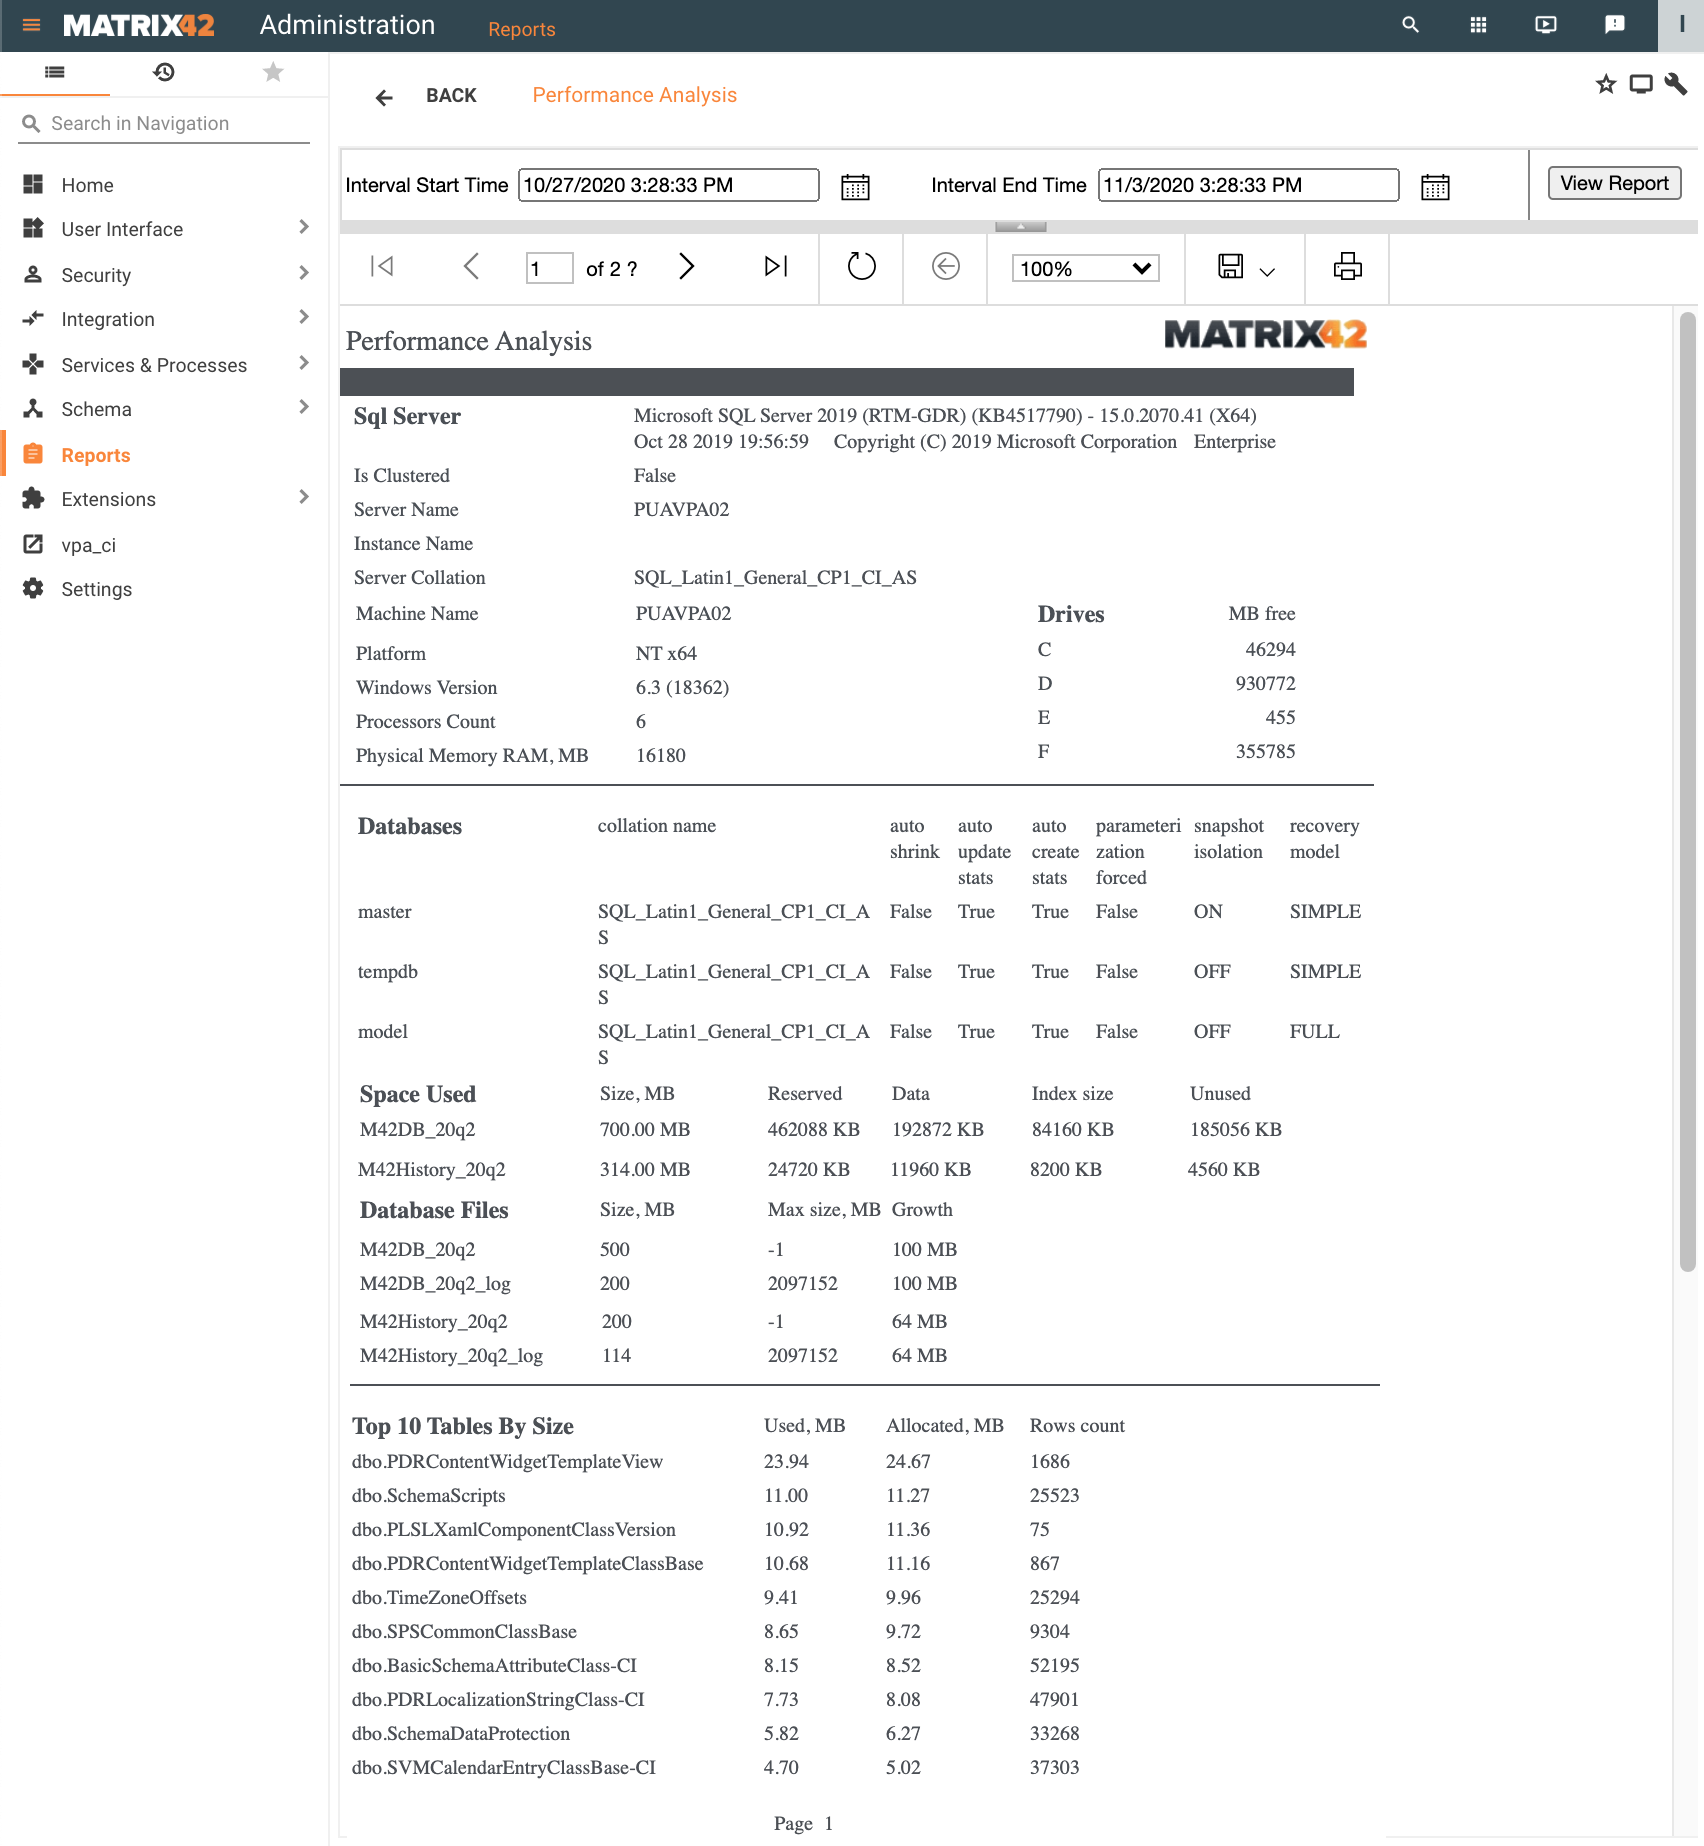
Performance Analysis
This page includes details about:
- SQL Server
- Databases
- Space Used
- Database Files
- Top 10 Tables by Size
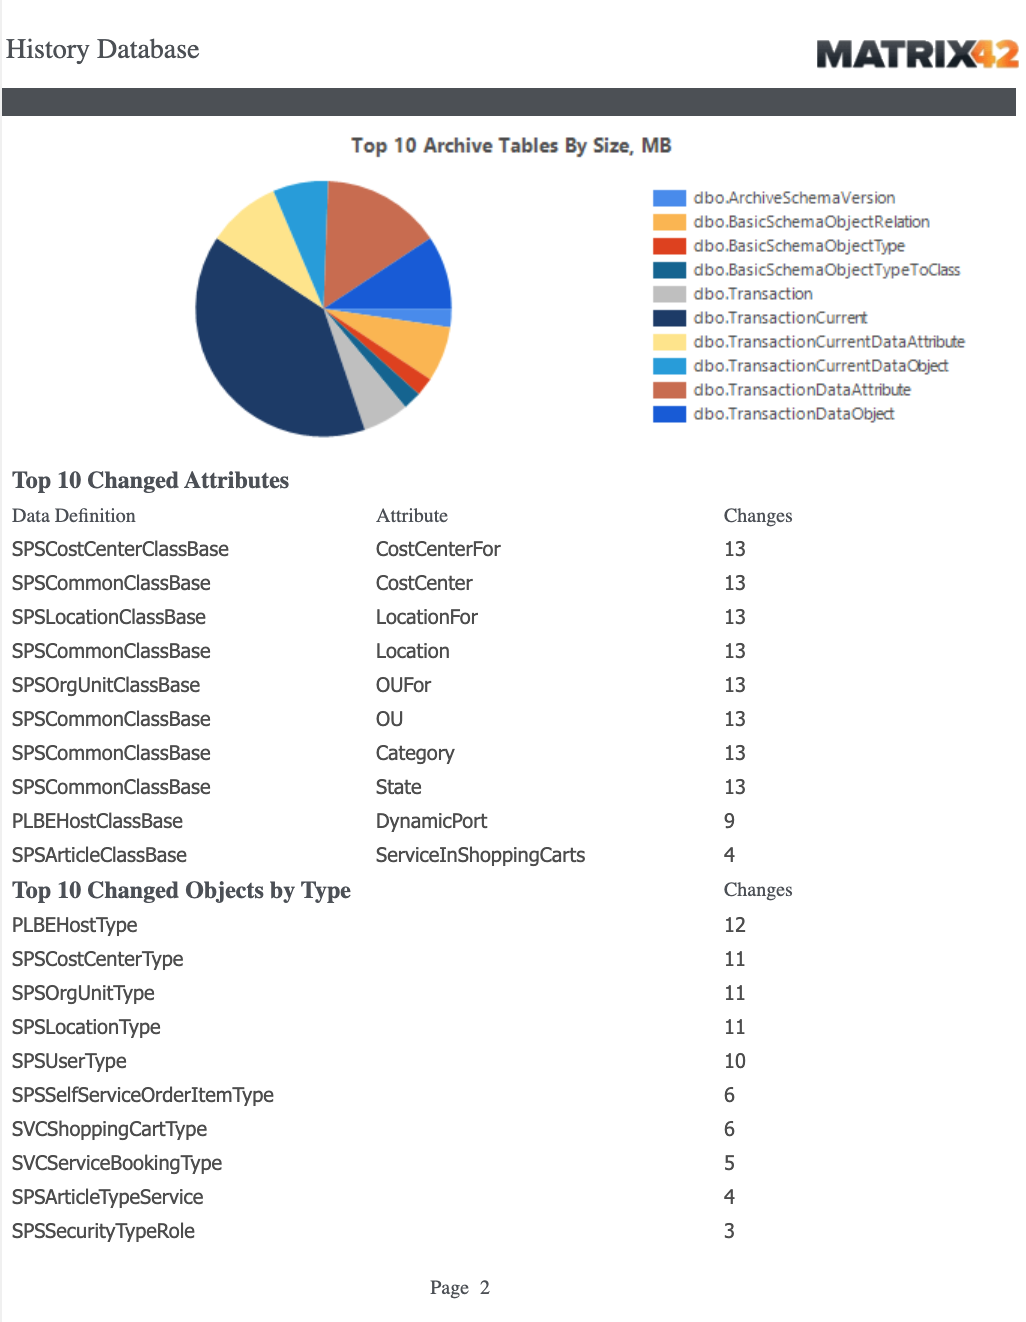
History Database
History Database data allows analyzing and considering to deactivate the history tracking option in the corresponding schema components:
- Top 10 Archive Tables by Size, MB
- Top 10 Changed Attributes of the Data Definitions
- Top 10 Changed Objects by Type in Configuration Items
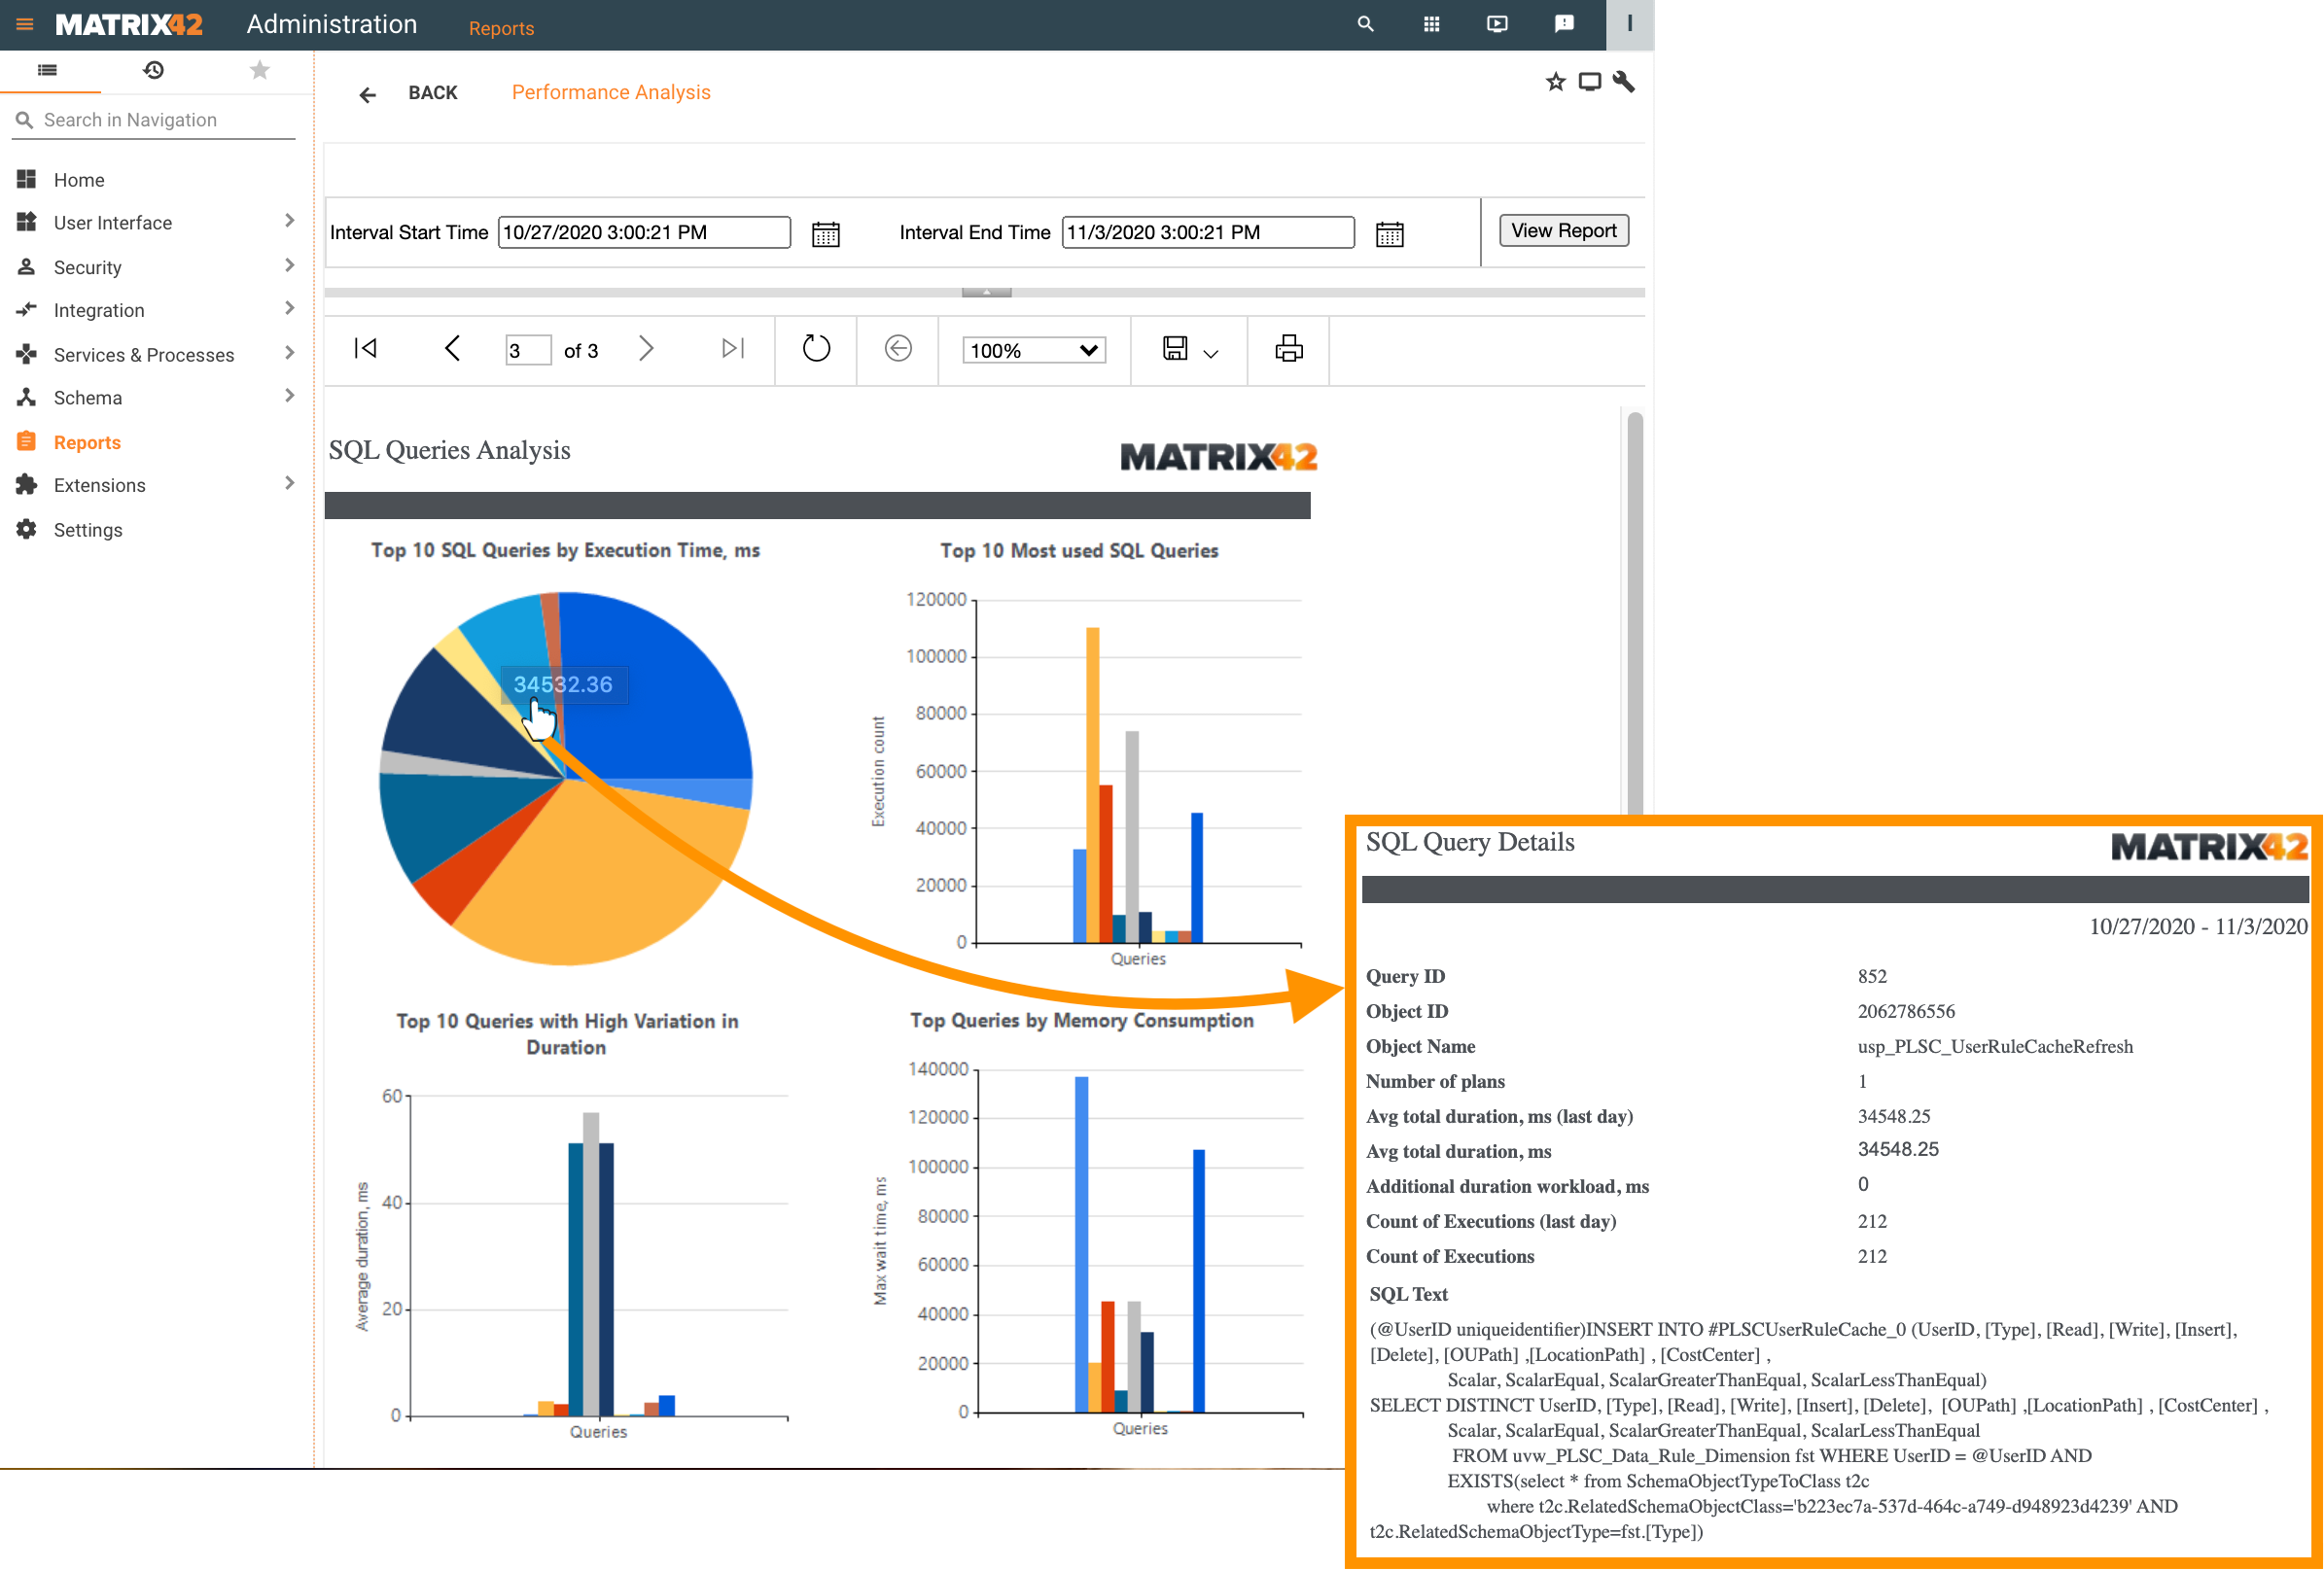
SQL Queries Analysis
This page includes the following information:
- Top 10 SQL Queries by Execution Time, ms
- Top 10 Most used SQL Queries
- Top 10 Queries with High Variation in Duration
- Top Queries by Memory Consumption
- Most Regressed Queries
- Top 10 Queries by CPU Time Consumption
- Top 10 Queries by Logical Reads, KB
Hover over and click on the chart data for more detailed information on the SQL Query.