Create your first Сontrol as a Community Extension
Overview
The default installation of the DWP provides a large variety of Сontrol Descriptors that can be adjusted and used on any type of Layout. However, you might need some extra control that is specific to your domain or fulfills your particular business needs. For instance, these might be a visual control used for the landing pages, like organization structure, maps, charts, timelines, etc.
From this step-by-step guide, you will learn how to build a Community Extension on the example of adding new Control Descriptors to the ESMP application. Further, these Extensions can be uploaded to the Extension Gallery and thus be applied not only within your organization but also shared and reused in other ESMP solutions.
Community Extensions are not supported by Matrix42 AG. For more details see Publish your Extension page.
As a basis, we will use a Highcharts JavaScript Library and adjust the chart example to be able to integrate it into ESMP as a new Control Descriptor.
Prerequisites
- You need to have access to the Application Server;
- Configuration Projects are available in the Administration application → Extensions navigation item.
Steps
- Create Configuration Project: create a new Configuration Project and start recording to track the changes that are made in the system.
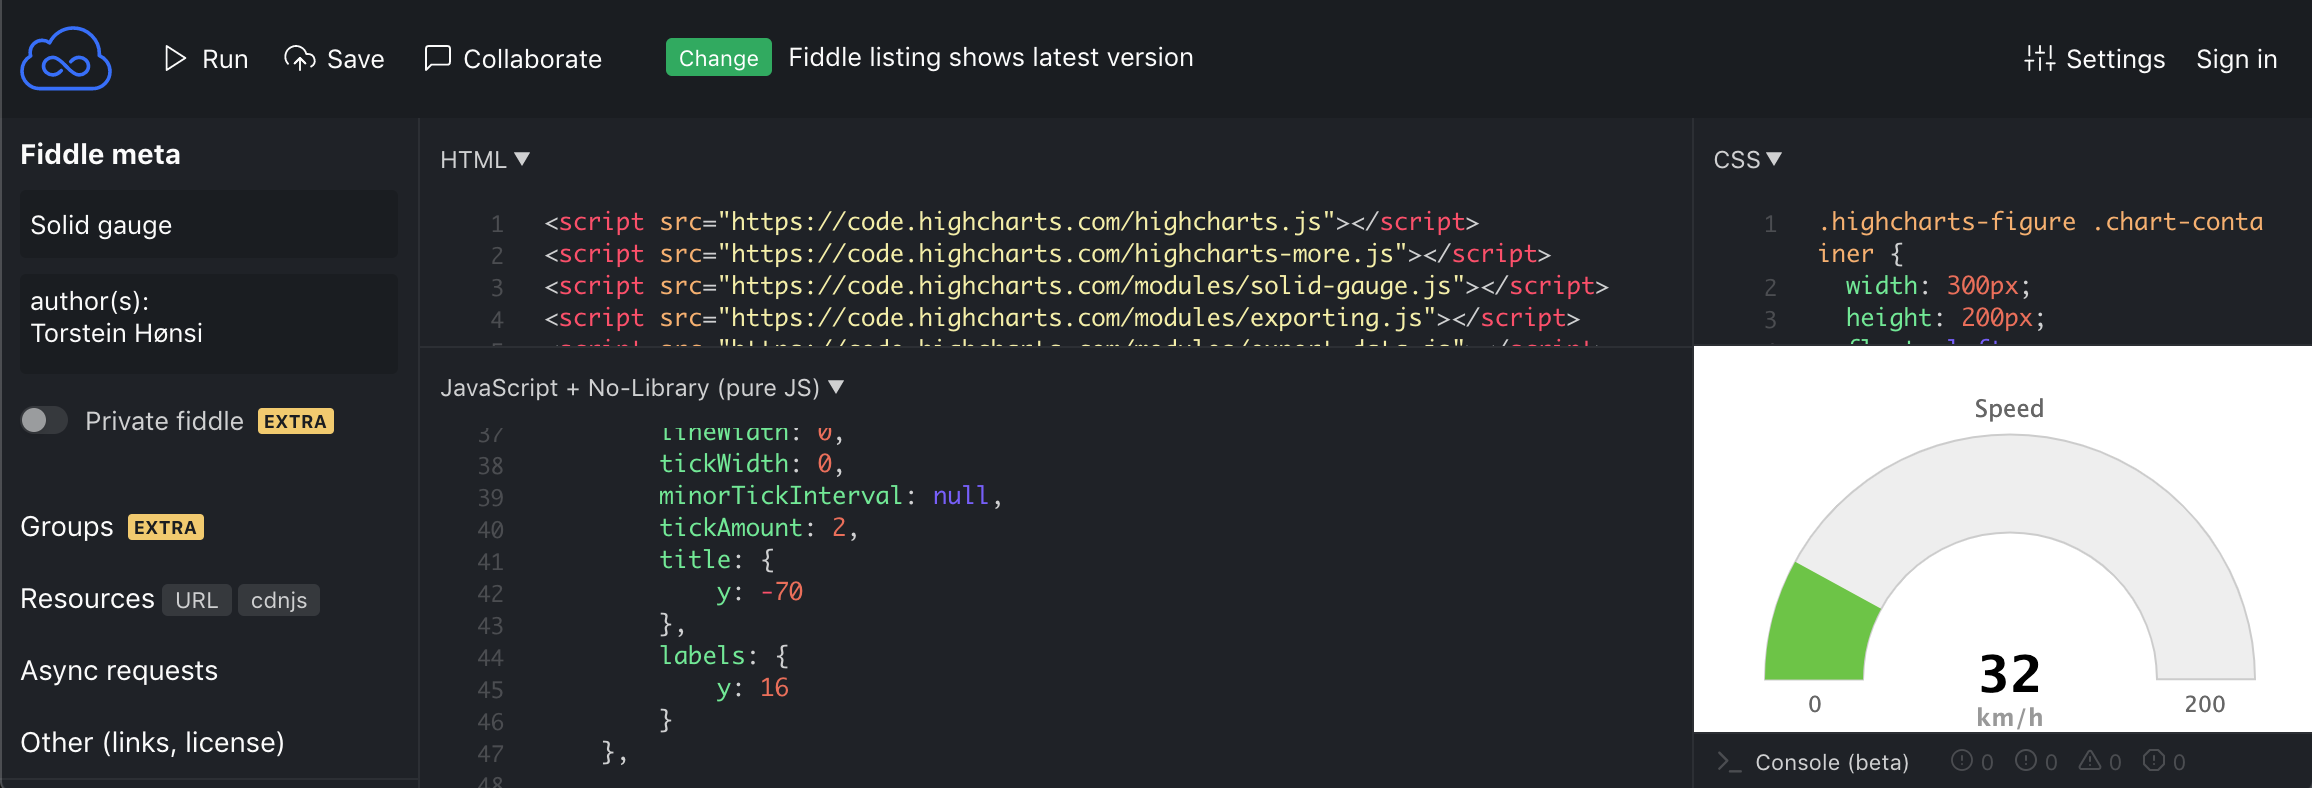
- Choose a chart: go to highcharts.com/demo site and choose the chart you would like to have as a Configuration Package in the Extension Gallery, e.g. Solid Gauge chart.
Click Edit in JSFiddle to access the source code that you will modify and adjust for the new Configuration Package:

- Create a new Workspace: go to the Application Server and in
/Matrix42/Matrix42 Workplace Management/WM/workspacescreate a new Workspace.
It is necessary for your new Custom control as it includes various front-end resources, like Javascript libraries, CSS, images, etc., that are required for building new User Interface modules. Add necessary resources and create aworkspace.jsonfile following the format suggested in the Front-End Workspaces article.
Example of workspace.json file content:{ "name": "@matrix42/<YourModuleName>", "version": "1.0.1", "description": "<description>", "resources": [ "ModuleTemplate.js" ] }
- Edit the ModuleTemplate.js file that implements the new control and defines all styles, JavaScript modules, and other resources that are used in the control and must be loaded with the new workspace. Use the template and rename the file according to the implemented module:
const yourModuleName = angular.module('mx.<YourNameHere>', [])
    .component('<yourNameHere>', {  //when declaring control in UUX, this name must be declared as <your-name-here>
        bindings: {
            chartTitle: '<',
            value: '<'
        },
       template: '<div id="<YourContainerContainerID>"></div>',
        controller: function ($q, $element, $ocLazyLoad, $injector) {

            this.containerId = '<YourContainerContainer>' + Date.now();
            $element.find('#<YourContainerContainerID>').attr('id', this.containerId);

            this.$onChanges = changes => {
                var that = this;
            if (changes.value) {
                //Load required dependencies
            return    $ocLazyLoad.load(['node_modules/highcharts/highcharts.js']).then(function(){
                    return $ocLazyLoad.load(['node_modules/highcharts/highcharts-more.js']);
                }).then(function(){
                    return $ocLazyLoad.load(['node_modules/highcharts/modules/solid-gauge.js']);
                }).then(function() {

                        renderChart(that.containerId, that.value, that.chartTitle);
                });
            }}

        function renderChart(id, value, chartTitle) {
            //Put all logic for rendering control here
        }

    }).name;
mx.workspacesConfig.registerModule(yourModuleName);
- ModuleName: unique name of the control;
- component: specify the technical name of the new control. This value is necessary for registering it in the Control Descriptor, i.e. with a running Configuration Package recording, when you create a new Control Descriptor in the user interface on the next step;
- bindings: list all configurable parameters for the control in bindings;
- Use template for HTML element that is necessary to display the control. Rename the ID from the source to have a unique ID for your element:

- controller is intended for JavaScript code:
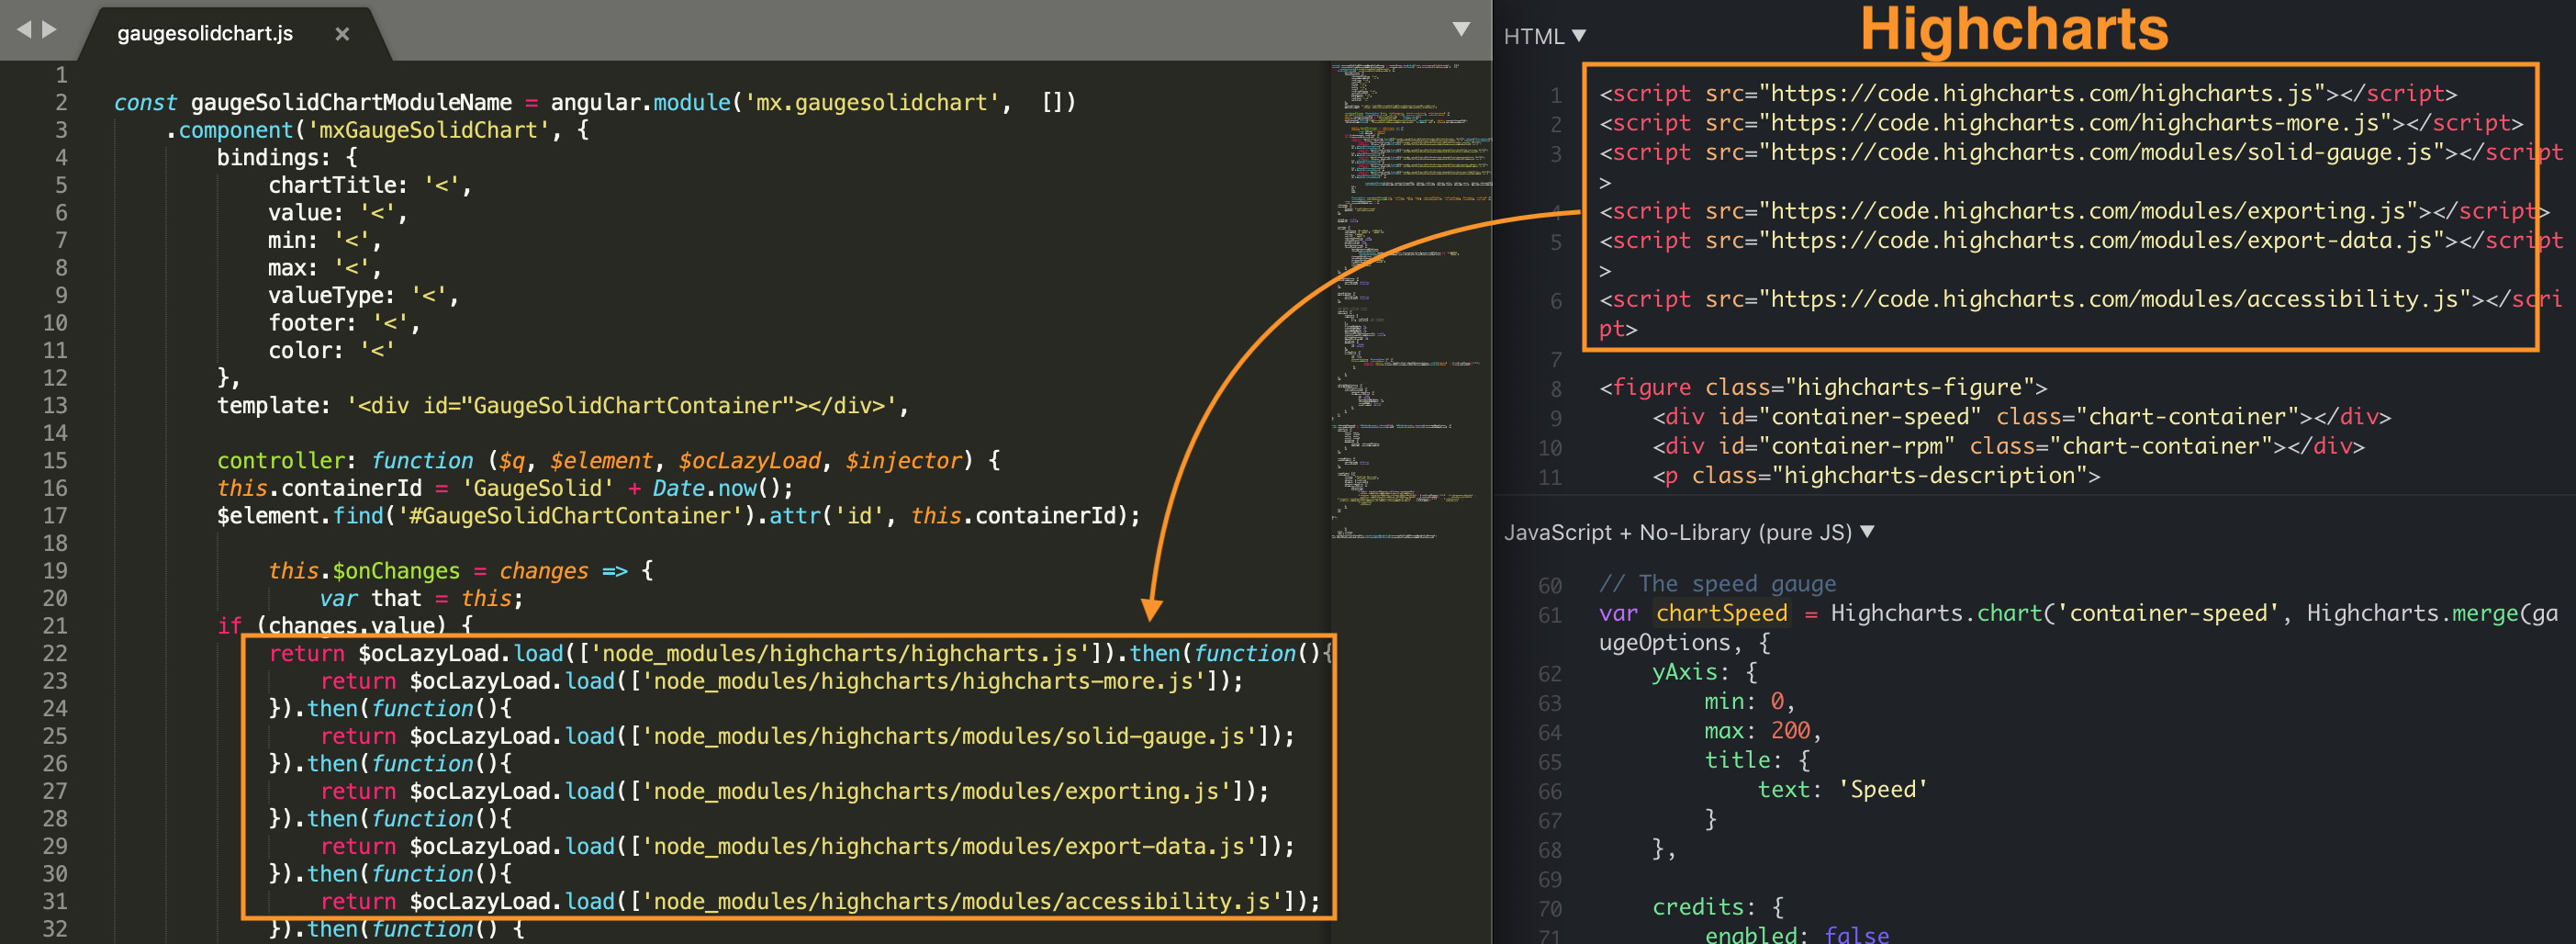
- Add necessary JS modules from the Highcharts to your modified template file:

The template already includes the JS code for the “lazy loading” of the control, which is a mechanism that allows improving the system performance and load the control only when it is used. Modify this code to validate the modules you are using in this control.The DWP already uses Highcharts, therefore some of the scripts were registered before and are already available as modules so that you will need to change the online resource reference to the modules to the path of the application.
See
/Matrix42/Matrix42 Workplace Management/WM/node_modules/highcharts/modulespath on the Application Server to check which modules are present.In case you want to add other resources that are not from the Highcharts module library, add them as files to your new workspace.
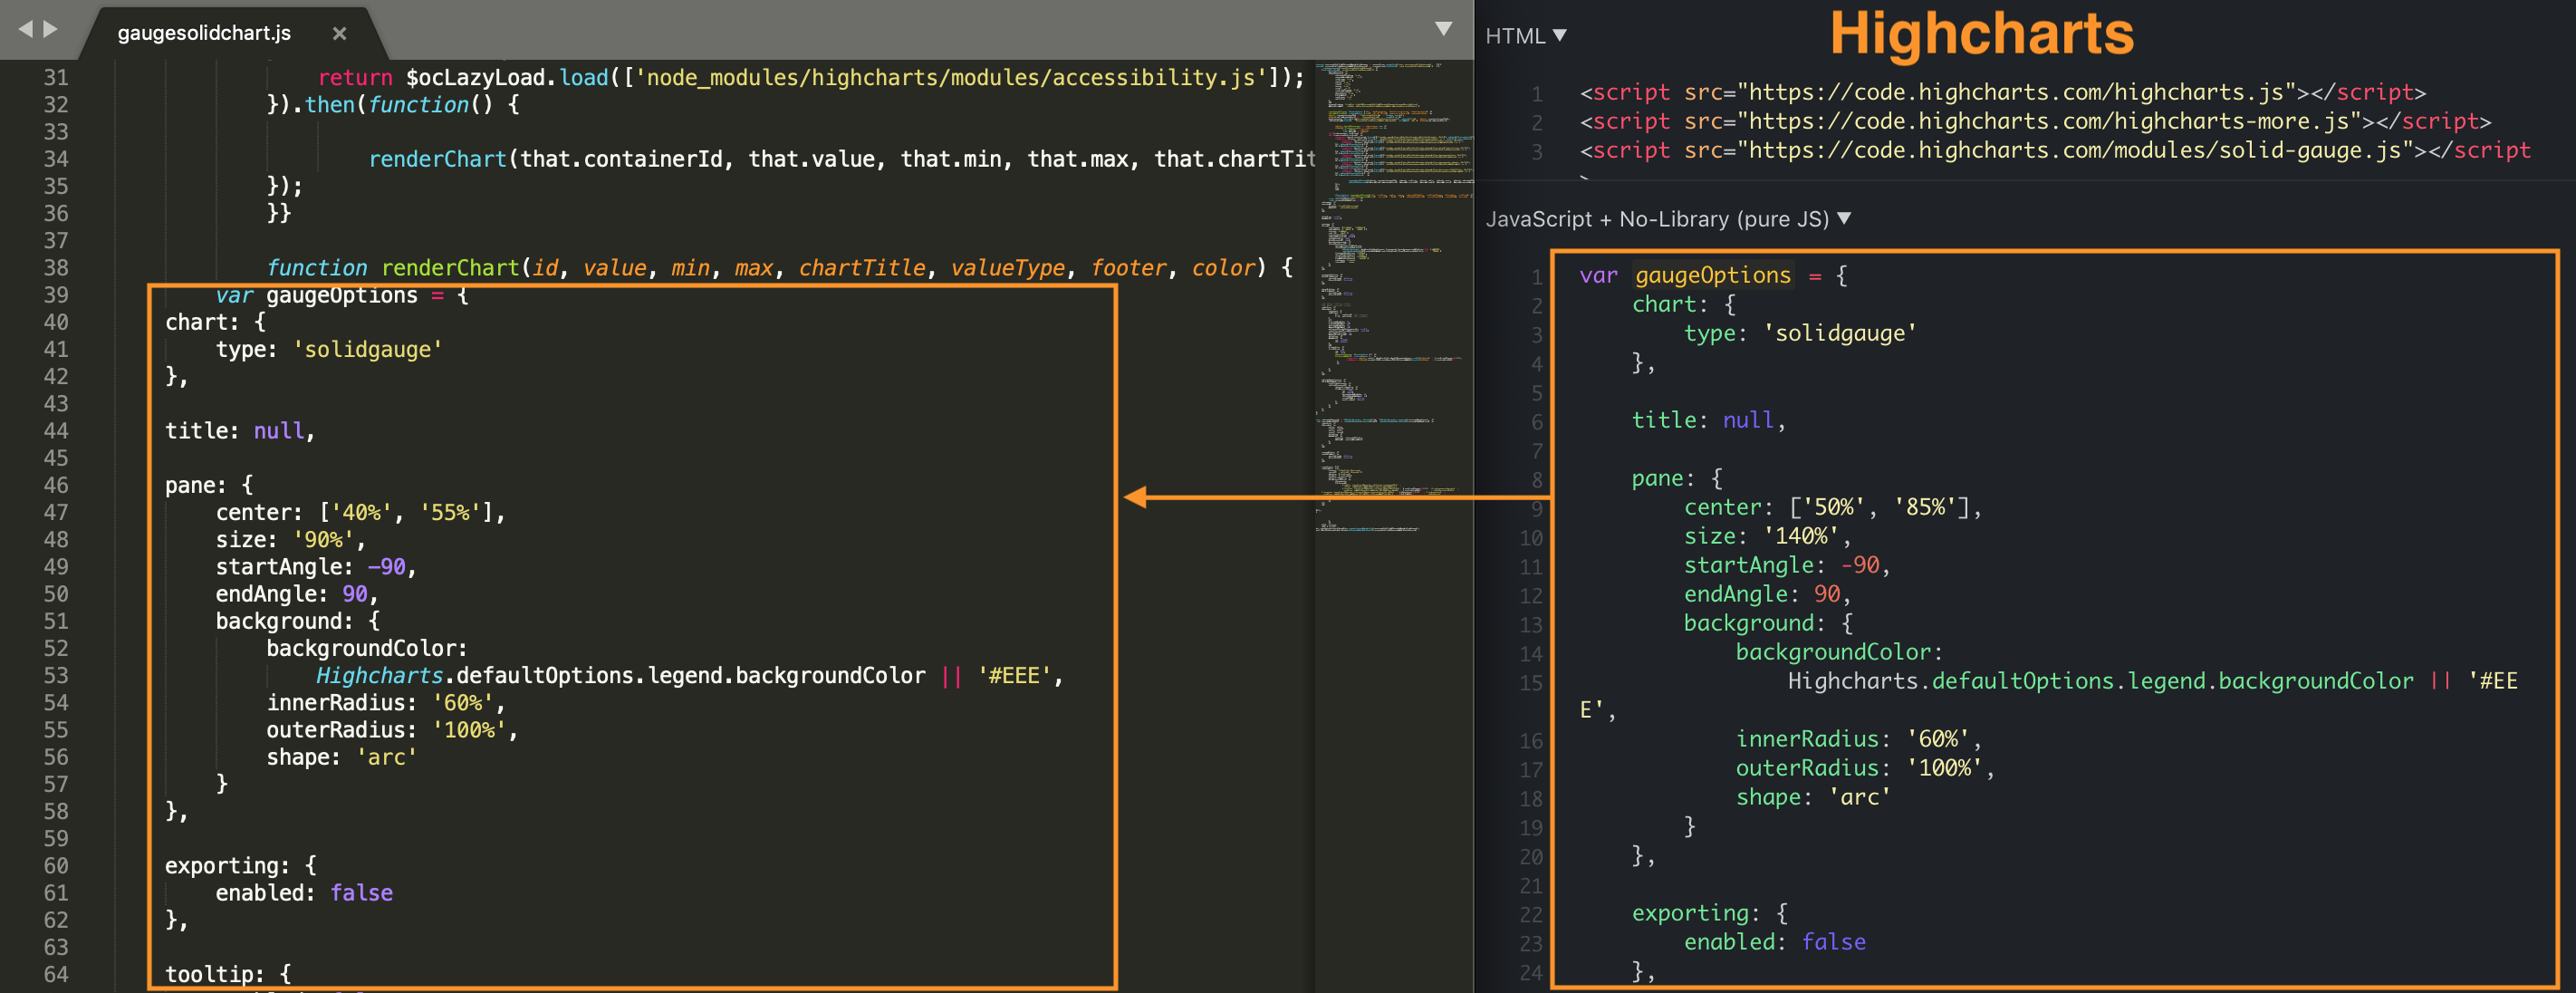
- Copy the JS code from the Highcharts editor to the renderChart function of the template file:

Modify the ID of the chart in the function according to the ID you provided in the template section of this file.
- Add necessary JS modules from the Highcharts to your modified template file:
5. Create a new Control Descriptor and define all necessary settings:
- General tab: for the Name field, use the value from the component section of the edited on the previous step JavaScript resources.
The name you put to this field is automatically converted to the camelCase, for example, the Name specified as mx-gauge-solid-chart results in the same value, as set in the component ‘mxGaugeSolidChart'
- Advanced tab: for the Tag Name, set the same value as you used in the Name field of the General tab on the previous step. Also, specify the Supported Widget Types where the new control can be used.
- Properties tab: add and configure every property that has been set in the bindings section of the template file. The same as for the Name in the General tab, the Name of the property is also converted to camelCase, e.g. the chart-title set in the Name of the Property field results in the same chartTitle in the property section of the edited template (see ModuleTemplate.js file example for the new Workspace).
For other properties configuration see Control Descriptor page.
6. Create necessary User Interface elements to define how to display your control: add Application, Navigation Item, Layout, Data Query, or any other element that is necessary for the new Custom Control Descriptor.
When everything is done, click Stop Recording action in the Configuration Projects and click Export to Package.
Proceed with publishing the new Control in the Extension Gallery as a Community package. For more details see Publish your Extension page.